OPEN-SOURCE SCRIPT
Connors RSI + Signal
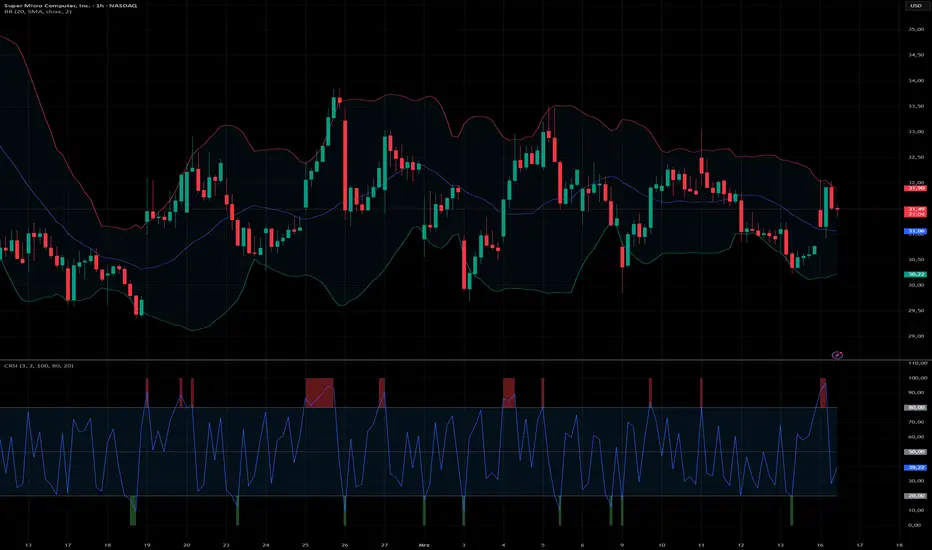
Connors RSI (CRSI) with Dynamic Zone Fills
Overview
This indicator enhances the classic Connors RSI (CRSI) by adding fully customizable, dynamic zone fills for overbought and oversold conditions. It is designed to give you a clear, immediate visual cue when the momentum reaches extreme levels, making it easier to spot potential mean-reversion setups at a glance.
Key Features
Recommended Usage & Pairings
The CRSI is a powerful oscillator for mean-reversion strategies, but it should rarely be used in isolation. For the best results, I highly recommend combining this indicator with price-based channel or volatility indicators:
Disclaimer
Use at your own risk. This script is provided for educational and informational purposes only and does not constitute financial advice. Trading in financial markets involves a high degree of risk and may not be suitable for all investors. Always backtest your strategies and do your own research before committing real capital.
Overview
This indicator enhances the classic Connors RSI (CRSI) by adding fully customizable, dynamic zone fills for overbought and oversold conditions. It is designed to give you a clear, immediate visual cue when the momentum reaches extreme levels, making it easier to spot potential mean-reversion setups at a glance.
Key Features
- Classic CRSI Formula: Combines a standard RSI, an Up/Down streak RSI, and a Rate of Change (ROC) Percent Rank to measure short-term momentum.
- Dynamic Highlighting: The area above the Upper Band and below the Lower Band automatically fills with color as soon as the CRSI crosses into these extreme zones.
- Fully Customizable Bands: You can easily adjust the Upper and Lower Band thresholds in the "Inputs" tab (default is 80 and 20). The background fills will automatically adapt to your custom levels.
Recommended Usage & Pairings
The CRSI is a powerful oscillator for mean-reversion strategies, but it should rarely be used in isolation. For the best results, I highly recommend combining this indicator with price-based channel or volatility indicators:
- Bollinger Bands: Look for confluence. A high-probability setup often occurs when the CRSI highlights an overbought/oversold zone at the same time the price touches or pierces the outer Bollinger Bands.
- Linear Regression Channel: Similar to Bollinger Bands, using a Linear Regression Channel helps you identify price extremes relative to the current trend. A CRSI signal aligning with the upper or lower boundaries of the channel offers a strong context for potential reversals.
Disclaimer
Use at your own risk. This script is provided for educational and informational purposes only and does not constitute financial advice. Trading in financial markets involves a high degree of risk and may not be suitable for all investors. Always backtest your strategies and do your own research before committing real capital.
오픈 소스 스크립트
트레이딩뷰의 진정한 정신에 따라, 이 스크립트의 작성자는 이를 오픈소스로 공개하여 트레이더들이 기능을 검토하고 검증할 수 있도록 했습니다. 작성자에게 찬사를 보냅니다! 이 코드는 무료로 사용할 수 있지만, 코드를 재게시하는 경우 하우스 룰이 적용된다는 점을 기억하세요.

면책사항
해당 정보와 게시물은 금융, 투자, 트레이딩 또는 기타 유형의 조언이나 권장 사항으로 간주되지 않으며, 트레이딩뷰에서 제공하거나 보증하는 것이 아닙니다. 자세한 내용은 이용 약관을 참조하세요.
오픈 소스 스크립트
트레이딩뷰의 진정한 정신에 따라, 이 스크립트의 작성자는 이를 오픈소스로 공개하여 트레이더들이 기능을 검토하고 검증할 수 있도록 했습니다. 작성자에게 찬사를 보냅니다! 이 코드는 무료로 사용할 수 있지만, 코드를 재게시하는 경우 하우스 룰이 적용된다는 점을 기억하세요.
면책사항
해당 정보와 게시물은 금융, 투자, 트레이딩 또는 기타 유형의 조언이나 권장 사항으로 간주되지 않으며, 트레이딩뷰에서 제공하거나 보증하는 것이 아닙니다. 자세한 내용은 이용 약관을 참조하세요.