OPEN-SOURCE SCRIPT
Decennial Pattern Projection
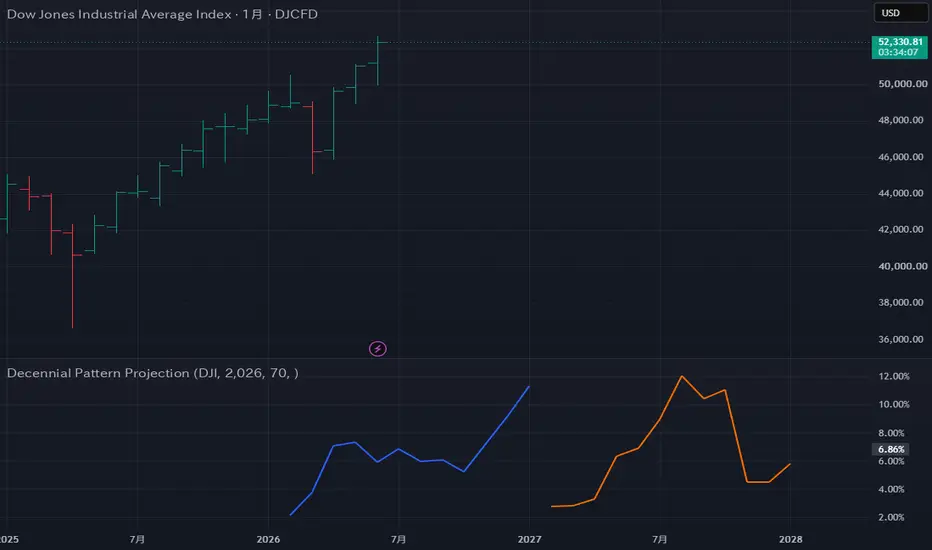
This tool was created to map out a "blueprint" for future market movements based on historical cycles.
**Important Prerequisite: Monthly Timeframe Only**
First and foremost, this indicator is designed exclusively for **monthly charts**.
If applied to other timeframes—such as daily or weekly charts—it is programmed to intentionally stop functioning and display an error message ("This indicator requires a Monthly timeframe") to prevent coordinate misalignment or redundant data calculations. Please ensure you use it only on monthly charts.
**Indicator Overview and Usage**
This indicator extracts the "10-year cycle pattern"—a classic market anomaly where performance trends align based on the last digit of the calendar year. It then plots a projected future trajectory—showing the "average year-to-date (YTD) movement (%)"—directly onto the chart for the specified year (and the following year).
**Practical Trading Applications**
**Grasping Broad Seasonality**
You can visually identify seasonal rhythms—such as which months tend to mark market bottoms or whether prices often weaken in early autumn—for years ending in a specific digit. This helps reduce the risk of unnecessary contrarian trades and allows you to formulate trading plans that align with historical capital flow patterns.
**Can it be used for entry and exit timing?**
This line does not generate direct buy/sell signals (such as arrows). However, it serves as a tool to gauge market strength and inform strategy when seasonal patterns are pronounced—such as considering long positions during "statistically strong months" or lightening positions (or switching to short strategies) during "weak months." It also helps you determine if the market is deviating from the anomaly due to specific, overriding biases.
**Improving Accuracy by Excluding "Black Swan" Events**
If you believe that outlier data from specific years—such as the 2008 Lehman Shock or the 2020 COVID-19 crash—is skewing the average, you can exclude those years via the settings. As this is a matter of individual judgment, one might choose not to exclude it if one views it as an inevitable occurrence aligned with cycles of debt or similar obligations.
**Important Prerequisite: Monthly Timeframe Only**
First and foremost, this indicator is designed exclusively for **monthly charts**.
If applied to other timeframes—such as daily or weekly charts—it is programmed to intentionally stop functioning and display an error message ("This indicator requires a Monthly timeframe") to prevent coordinate misalignment or redundant data calculations. Please ensure you use it only on monthly charts.
**Indicator Overview and Usage**
This indicator extracts the "10-year cycle pattern"—a classic market anomaly where performance trends align based on the last digit of the calendar year. It then plots a projected future trajectory—showing the "average year-to-date (YTD) movement (%)"—directly onto the chart for the specified year (and the following year).
**Practical Trading Applications**
**Grasping Broad Seasonality**
You can visually identify seasonal rhythms—such as which months tend to mark market bottoms or whether prices often weaken in early autumn—for years ending in a specific digit. This helps reduce the risk of unnecessary contrarian trades and allows you to formulate trading plans that align with historical capital flow patterns.
**Can it be used for entry and exit timing?**
This line does not generate direct buy/sell signals (such as arrows). However, it serves as a tool to gauge market strength and inform strategy when seasonal patterns are pronounced—such as considering long positions during "statistically strong months" or lightening positions (or switching to short strategies) during "weak months." It also helps you determine if the market is deviating from the anomaly due to specific, overriding biases.
**Improving Accuracy by Excluding "Black Swan" Events**
If you believe that outlier data from specific years—such as the 2008 Lehman Shock or the 2020 COVID-19 crash—is skewing the average, you can exclude those years via the settings. As this is a matter of individual judgment, one might choose not to exclude it if one views it as an inevitable occurrence aligned with cycles of debt or similar obligations.
오픈 소스 스크립트
트레이딩뷰의 진정한 정신에 따라, 이 스크립트의 작성자는 이를 오픈소스로 공개하여 트레이더들이 기능을 검토하고 검증할 수 있도록 했습니다. 작성자에게 찬사를 보냅니다! 이 코드는 무료로 사용할 수 있지만, 코드를 재게시하는 경우 하우스 룰이 적용된다는 점을 기억하세요.

면책사항
해당 정보와 게시물은 금융, 투자, 트레이딩 또는 기타 유형의 조언이나 권장 사항으로 간주되지 않으며, 트레이딩뷰에서 제공하거나 보증하는 것이 아닙니다. 자세한 내용은 이용 약관을 참조하세요.
오픈 소스 스크립트
트레이딩뷰의 진정한 정신에 따라, 이 스크립트의 작성자는 이를 오픈소스로 공개하여 트레이더들이 기능을 검토하고 검증할 수 있도록 했습니다. 작성자에게 찬사를 보냅니다! 이 코드는 무료로 사용할 수 있지만, 코드를 재게시하는 경우 하우스 룰이 적용된다는 점을 기억하세요.
면책사항
해당 정보와 게시물은 금융, 투자, 트레이딩 또는 기타 유형의 조언이나 권장 사항으로 간주되지 않으며, 트레이딩뷰에서 제공하거나 보증하는 것이 아닙니다. 자세한 내용은 이용 약관을 참조하세요.