OPEN-SOURCE SCRIPT
Probabilistic Breakout Forecaster [LuxAlgo]
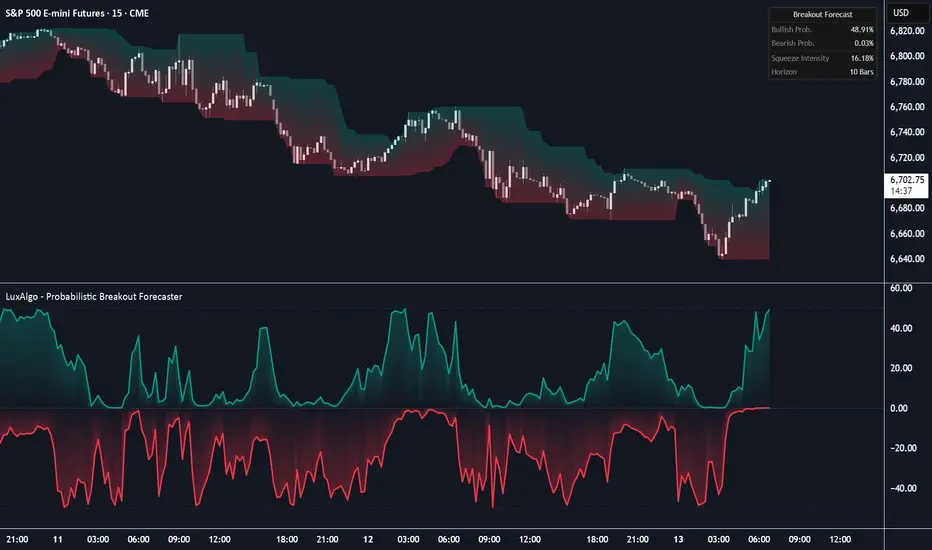
The Probabilistic Breakout Forecaster indicator calculates the statistical probability of price breaking out of a defined range within a specific future time horizon. Using a log-normal random walk model, it provides traders with a quantitative estimate of whether current price action is likely to exceed local highs or lows.
🔶 USAGE
The indicator is displayed in a separate pane, showing two oscillating probability lines: a bullish breakout probability (positive values) and a bearish breakout probability (negative values).
When the bullish probability line approaches or exceeds the 50% threshold, it indicates a higher statistical likelihood that the price will break above the recent range high within the specified forecast horizon. Conversely, when the bearish probability line (plotted negatively) reaches the -50% threshold, it suggests a high probability of a breakdown below the recent range low.
The tool is particularly useful for:
🔹 Dashboard
The real-time dashboard provides a concise summary of the current forecast:
🔶 DETAILS
The script utilizes a Log-Normal Random Walk model to forecast price distributions. This approach assumes that price returns follow a normal distribution, allowing the script to calculate the Z-score for the distance between the current price and the range boundaries.
🔹 Breakout Probability
The probability is derived using the Normal Cumulative Distribution Function (CDF). It calculates the area under the bell curve beyond the upper and lower range boundaries, adjusted for the square root of time (Forecast Horizon) and the standard deviation of log returns (Volatility Lookback).
🔹 Volatility Squeeze
The Squeeze Intensity metric compares the current Average True Range (ATR) to its 100-period simple moving average. When the ATR is significantly lower than its historical average, the intensity increases, signaling that the market is in a period of low-volatility consolidation that often leads to a "volatility explosion."
🔶 SETTINGS
🔹 Calculation Settings
🔹 Visualization
🔹 Dashboard
🔶 USAGE
The indicator is displayed in a separate pane, showing two oscillating probability lines: a bullish breakout probability (positive values) and a bearish breakout probability (negative values).
When the bullish probability line approaches or exceeds the 50% threshold, it indicates a higher statistical likelihood that the price will break above the recent range high within the specified forecast horizon. Conversely, when the bearish probability line (plotted negatively) reaches the -50% threshold, it suggests a high probability of a breakdown below the recent range low.
The tool is particularly useful for:
- Identifying potential breakout candidates before the price movement occurs.
- Assessing the risk of "fakeouts" by comparing price proximity to the range boundary versus the statistical probability of a sustained move.
- Determining if current volatility levels are sufficient to support a trend continuation.
🔹 Dashboard
The real-time dashboard provides a concise summary of the current forecast:
- Bullish/Bearish Probabilities: The exact percentage chance of a breakout within the selected horizon.
- Squeeze Intensity: A metric indicating how compressed the current volatility is relative to historical averages. High squeeze intensity (above 50%) often precedes significant expansion.
- Horizon: The number of bars the current forecast is looking into the future.
🔶 DETAILS
The script utilizes a Log-Normal Random Walk model to forecast price distributions. This approach assumes that price returns follow a normal distribution, allowing the script to calculate the Z-score for the distance between the current price and the range boundaries.
🔹 Breakout Probability
The probability is derived using the Normal Cumulative Distribution Function (CDF). It calculates the area under the bell curve beyond the upper and lower range boundaries, adjusted for the square root of time (Forecast Horizon) and the standard deviation of log returns (Volatility Lookback).
🔹 Volatility Squeeze
The Squeeze Intensity metric compares the current Average True Range (ATR) to its 100-period simple moving average. When the ATR is significantly lower than its historical average, the intensity increases, signaling that the market is in a period of low-volatility consolidation that often leads to a "volatility explosion."
🔶 SETTINGS
🔹 Calculation Settings
- Range Length: The lookback period used to determine the highest high and lowest low that act as the breakout boundaries.
- Forecast Horizon (Bars): The number of bars into the future the model is predicting. A longer horizon generally increases the probability of hitting a boundary but decreases the precision of the timing.
- Volatility Lookback: The period used to calculate the standard deviation of log returns, which informs the "width" of the expected price distribution.
🔹 Visualization
- Bullish/Bearish Color: Customizes the colors for the respective probability plots and fills.
- Fill Transparency: Adjusts the visibility of the area between the probability lines and the zero baseline.
🔹 Dashboard
- Enable Dashboard: Toggles the visibility of the on-screen information table.
- Position: Moves the dashboard to different corners of the chart.
- Size: Adjusts the scale of the dashboard text and cells.
오픈 소스 스크립트
트레이딩뷰의 진정한 정신에 따라, 이 스크립트의 작성자는 이를 오픈소스로 공개하여 트레이더들이 기능을 검토하고 검증할 수 있도록 했습니다. 작성자에게 찬사를 보냅니다! 이 코드는 무료로 사용할 수 있지만, 코드를 재게시하는 경우 하우스 룰이 적용된다는 점을 기억하세요.

Build your own edge with AI: luxalgo.com
All content provided by LuxAlgo is for informational & educational purposes only. Past performance does not guarantee future results.
All content provided by LuxAlgo is for informational & educational purposes only. Past performance does not guarantee future results.
면책사항
해당 정보와 게시물은 금융, 투자, 트레이딩 또는 기타 유형의 조언이나 권장 사항으로 간주되지 않으며, 트레이딩뷰에서 제공하거나 보증하는 것이 아닙니다. 자세한 내용은 이용 약관을 참조하세요.
오픈 소스 스크립트
트레이딩뷰의 진정한 정신에 따라, 이 스크립트의 작성자는 이를 오픈소스로 공개하여 트레이더들이 기능을 검토하고 검증할 수 있도록 했습니다. 작성자에게 찬사를 보냅니다! 이 코드는 무료로 사용할 수 있지만, 코드를 재게시하는 경우 하우스 룰이 적용된다는 점을 기억하세요.
Build your own edge with AI: luxalgo.com
All content provided by LuxAlgo is for informational & educational purposes only. Past performance does not guarantee future results.
All content provided by LuxAlgo is for informational & educational purposes only. Past performance does not guarantee future results.
면책사항
해당 정보와 게시물은 금융, 투자, 트레이딩 또는 기타 유형의 조언이나 권장 사항으로 간주되지 않으며, 트레이딩뷰에서 제공하거나 보증하는 것이 아닙니다. 자세한 내용은 이용 약관을 참조하세요.