OPEN-SOURCE SCRIPT
Market Cap + Avg Traded Value In Crore
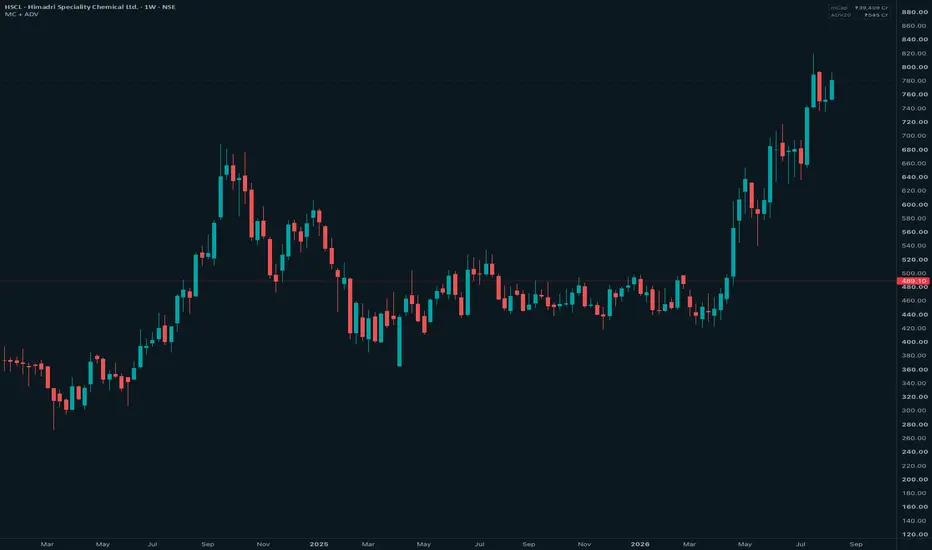
A minimal market overview indicator that displays two important stock metrics directly on the chart:
• Market Capitalization (₹ Crore)
• 20-Day Average Traded Value (₹ Crore)
Designed for quick stock analysis and liquidity assessment, especially for Indian equities.
Features:
✓ Market cap calculated dynamically using current price and shares outstanding
✓ 20-day average daily traded value calculated from daily data
✓ Works across intraday and higher timeframes
✓ Minimal floating table with customizable position
✓ Custom value color
✓ TradingView status line support for fast scanning
✓ Indian number formatting with Cr suffix
Average Traded Value (ADV) represents the average rupee value traded per day, helping traders compare liquidity across stocks regardless of share price.
Useful for:
• Stock screening
• Liquidity filtering
• Watchlist analysis
• Swing trading preparation
• Long-term investment research
This indicator is designed as a clean companion tool for traders who want essential stock information without cluttering their charts.
Note:
Market data availability depends on TradingView's supported financial data sources.
• Market Capitalization (₹ Crore)
• 20-Day Average Traded Value (₹ Crore)
Designed for quick stock analysis and liquidity assessment, especially for Indian equities.
Features:
✓ Market cap calculated dynamically using current price and shares outstanding
✓ 20-day average daily traded value calculated from daily data
✓ Works across intraday and higher timeframes
✓ Minimal floating table with customizable position
✓ Custom value color
✓ TradingView status line support for fast scanning
✓ Indian number formatting with Cr suffix
Average Traded Value (ADV) represents the average rupee value traded per day, helping traders compare liquidity across stocks regardless of share price.
Useful for:
• Stock screening
• Liquidity filtering
• Watchlist analysis
• Swing trading preparation
• Long-term investment research
This indicator is designed as a clean companion tool for traders who want essential stock information without cluttering their charts.
Note:
Market data availability depends on TradingView's supported financial data sources.
오픈 소스 스크립트
트레이딩뷰의 진정한 정신에 따라, 이 스크립트의 작성자는 이를 오픈소스로 공개하여 트레이더들이 기능을 검토하고 검증할 수 있도록 했습니다. 작성자에게 찬사를 보냅니다! 이 코드는 무료로 사용할 수 있지만, 코드를 재게시하는 경우 하우스 룰이 적용된다는 점을 기억하세요.

면책사항
해당 정보와 게시물은 금융, 투자, 트레이딩 또는 기타 유형의 조언이나 권장 사항으로 간주되지 않으며, 트레이딩뷰에서 제공하거나 보증하는 것이 아닙니다. 자세한 내용은 이용 약관을 참조하세요.
오픈 소스 스크립트
트레이딩뷰의 진정한 정신에 따라, 이 스크립트의 작성자는 이를 오픈소스로 공개하여 트레이더들이 기능을 검토하고 검증할 수 있도록 했습니다. 작성자에게 찬사를 보냅니다! 이 코드는 무료로 사용할 수 있지만, 코드를 재게시하는 경우 하우스 룰이 적용된다는 점을 기억하세요.
면책사항
해당 정보와 게시물은 금융, 투자, 트레이딩 또는 기타 유형의 조언이나 권장 사항으로 간주되지 않으며, 트레이딩뷰에서 제공하거나 보증하는 것이 아닙니다. 자세한 내용은 이용 약관을 참조하세요.