OPEN-SOURCE SCRIPT
업데이트됨 Levels + 8H Boxes
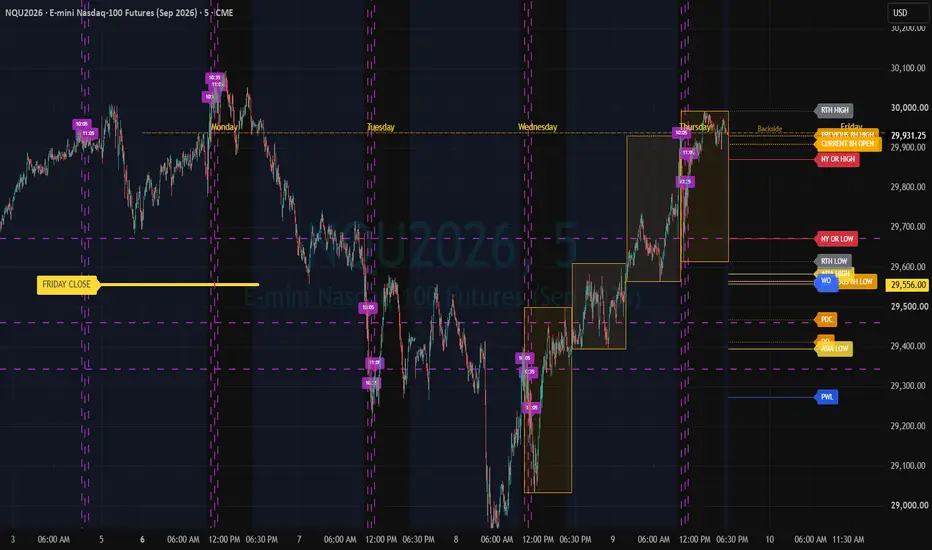
Levels + 8H Boxes
Levels Only is a clean, signal-free market structure indicator designed to show the key price levels traders often use to build a higher-timeframe thesis before looking for an entry.
This indicator does not generate buy or sell signals. It is designed as a visual map of important liquidity, reference, and session levels so traders can see where price is trading in relation to higher-timeframe structure.
The indicator displays:
Monthly Levels — Previous Monthly High, Low, and Close, plus the Current Monthly Open
Weekly Levels — Previous Weekly High, Low, and Close, plus the Current Weekly Open
Daily Levels — Previous Daily High, Low, and Close, plus the Current Daily Open
8-Hour Levels — Previous 8H High, Low, and Close, plus the Current 8H Open
Asia High and Low
New York Opening Range High and Low
Regular Trading Hours High and Low
8-Hour Range Boxes
The main visual feature is the two-box 8-hour structure:
Teal Box — Current 8H Range
The teal box tracks the high and low of the active 8-hour candle. As the current 8-hour candle expands, the box updates with it.
Blue Box — Previous 8H Range
The blue box displays the high and low of the previous completed 8-hour candle and is positioned to the left of the current range for easy comparison.
Together, the boxes help answer:
Is price trading inside or outside the previous 8H range?
Did price sweep the previous 8H high or low?
Is the current 8H candle expanding or compressing?
Is price accepting outside the previous range or rejecting back inside?
Which side of the 8H range may contain the next liquidity target?
How It Can Be Used
The indicator is built around a top-down process:
Monthly / Weekly Context → Daily Setup → 8H Structure → Session Levels → Lower-Timeframe Execution
A trader can use the map to form a thesis first, then move to a lower timeframe to look for their own confirmation or execution model.
For example, the previous 8H range can provide context while the current 8H range shows active price development. Asia highs and lows, daily levels, and the New York opening range can then help identify areas where liquidity may be resting.
Important
This is a levels-only indicator.
There are:
No buy signals
No sell signals
No entry arrows
No automated trade recommendations
The purpose is simple:
Map the levels. Build the thesis. Wait for price to show its hand.
All major level groups and 8-hour boxes can be turned on or off in the indicator settings.
Best suited for: futures, indices, forex, and other liquid markets where higher-timeframe and session-based structure are important.
Please visit TraderTaxPrep.com Trader Tax Prep gives beginner traders a simple system for knowing what to track , what to save , and what to bring to a tax professional.
Levels Only is a clean, signal-free market structure indicator designed to show the key price levels traders often use to build a higher-timeframe thesis before looking for an entry.
This indicator does not generate buy or sell signals. It is designed as a visual map of important liquidity, reference, and session levels so traders can see where price is trading in relation to higher-timeframe structure.
The indicator displays:
Monthly Levels — Previous Monthly High, Low, and Close, plus the Current Monthly Open
Weekly Levels — Previous Weekly High, Low, and Close, plus the Current Weekly Open
Daily Levels — Previous Daily High, Low, and Close, plus the Current Daily Open
8-Hour Levels — Previous 8H High, Low, and Close, plus the Current 8H Open
Asia High and Low
New York Opening Range High and Low
Regular Trading Hours High and Low
8-Hour Range Boxes
The main visual feature is the two-box 8-hour structure:
Teal Box — Current 8H Range
The teal box tracks the high and low of the active 8-hour candle. As the current 8-hour candle expands, the box updates with it.
Blue Box — Previous 8H Range
The blue box displays the high and low of the previous completed 8-hour candle and is positioned to the left of the current range for easy comparison.
Together, the boxes help answer:
Is price trading inside or outside the previous 8H range?
Did price sweep the previous 8H high or low?
Is the current 8H candle expanding or compressing?
Is price accepting outside the previous range or rejecting back inside?
Which side of the 8H range may contain the next liquidity target?
How It Can Be Used
The indicator is built around a top-down process:
Monthly / Weekly Context → Daily Setup → 8H Structure → Session Levels → Lower-Timeframe Execution
A trader can use the map to form a thesis first, then move to a lower timeframe to look for their own confirmation or execution model.
For example, the previous 8H range can provide context while the current 8H range shows active price development. Asia highs and lows, daily levels, and the New York opening range can then help identify areas where liquidity may be resting.
Important
This is a levels-only indicator.
There are:
No buy signals
No sell signals
No entry arrows
No automated trade recommendations
The purpose is simple:
Map the levels. Build the thesis. Wait for price to show its hand.
All major level groups and 8-hour boxes can be turned on or off in the indicator settings.
Best suited for: futures, indices, forex, and other liquid markets where higher-timeframe and session-based structure are important.
Please visit TraderTaxPrep.com Trader Tax Prep gives beginner traders a simple system for knowing what to track , what to save , and what to bring to a tax professional.
릴리즈 노트
Update to the name on the screen.릴리즈 노트
-added -Days of the week
-Friday close line that goes into monday
-10:05, 10:35, 11:05 time slots
- 4 8HR boxes
오픈 소스 스크립트
트레이딩뷰의 진정한 정신에 따라, 이 스크립트의 작성자는 이를 오픈소스로 공개하여 트레이더들이 기능을 검토하고 검증할 수 있도록 했습니다. 작성자에게 찬사를 보냅니다! 이 코드는 무료로 사용할 수 있지만, 코드를 재게시하는 경우 하우스 룰이 적용된다는 점을 기억하세요.

면책사항
해당 정보와 게시물은 금융, 투자, 트레이딩 또는 기타 유형의 조언이나 권장 사항으로 간주되지 않으며, 트레이딩뷰에서 제공하거나 보증하는 것이 아닙니다. 자세한 내용은 이용 약관을 참조하세요.
오픈 소스 스크립트
트레이딩뷰의 진정한 정신에 따라, 이 스크립트의 작성자는 이를 오픈소스로 공개하여 트레이더들이 기능을 검토하고 검증할 수 있도록 했습니다. 작성자에게 찬사를 보냅니다! 이 코드는 무료로 사용할 수 있지만, 코드를 재게시하는 경우 하우스 룰이 적용된다는 점을 기억하세요.
면책사항
해당 정보와 게시물은 금융, 투자, 트레이딩 또는 기타 유형의 조언이나 권장 사항으로 간주되지 않으며, 트레이딩뷰에서 제공하거나 보증하는 것이 아닙니다. 자세한 내용은 이용 약관을 참조하세요.