Sphinx Fixed Price Grid
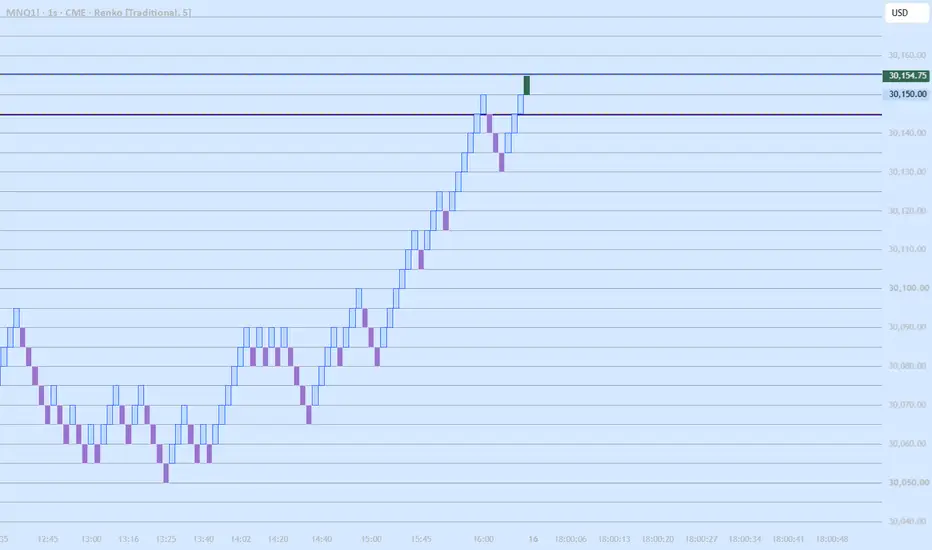
A grid of horizontal lines at every N-point multiple of price, plus the order prices those multiples imply.
What it does
The grid is computed as floor(price / step) × step. It depends on price alone, so the same levels appear on every chart, every reload, and every timeframe. There is no anchor bar and no state carried between sessions.
Why that matters
Traditional Renko anchors its brick sequence to the start of available data rather than to a price grid. There is no offset input, and the anchor can move when the data window changes — loading more history, switching sessions, or reloading the chart. Brick boundaries are therefore not a stable price reference, even though they look like one.
Any method that places orders relative to brick edges inherits that instability. This indicator computes the levels arithmetically instead, so they are reproducible.
Order levels
Optionally marks the entry and protective stop implied by the current grid position, on both sides. Entry sits one tick beyond the next grid level so a stop order triggers on a break rather than a touch; the protective stop sits on the grid level a configurable number of steps away. The tick offset applies to the entry only — offsetting both ends would change the risk distance without it being obvious.
Distances are shown in points on the labels and exported to the data window.
Drift check
An optional readout comparing the current close against the nearest grid level. On a Renko chart this reveals whether the plotted brick boundaries sit on grid prices or somewhere between them. A non-zero reading means brick edges are not grid levels and should not be used as order prices.
Notes
Set the grid step to match your brick size. The indicator draws levels and reports distances only. It reads no trend, generates no signals, and takes no directional view.
What it does
The grid is computed as floor(price / step) × step. It depends on price alone, so the same levels appear on every chart, every reload, and every timeframe. There is no anchor bar and no state carried between sessions.
Why that matters
Traditional Renko anchors its brick sequence to the start of available data rather than to a price grid. There is no offset input, and the anchor can move when the data window changes — loading more history, switching sessions, or reloading the chart. Brick boundaries are therefore not a stable price reference, even though they look like one.
Any method that places orders relative to brick edges inherits that instability. This indicator computes the levels arithmetically instead, so they are reproducible.
Order levels
Optionally marks the entry and protective stop implied by the current grid position, on both sides. Entry sits one tick beyond the next grid level so a stop order triggers on a break rather than a touch; the protective stop sits on the grid level a configurable number of steps away. The tick offset applies to the entry only — offsetting both ends would change the risk distance without it being obvious.
Distances are shown in points on the labels and exported to the data window.
Drift check
An optional readout comparing the current close against the nearest grid level. On a Renko chart this reveals whether the plotted brick boundaries sit on grid prices or somewhere between them. A non-zero reading means brick edges are not grid levels and should not be used as order prices.
Notes
Set the grid step to match your brick size. The indicator draws levels and reports distances only. It reads no trend, generates no signals, and takes no directional view.

Hermetic Trader · "What gets measured gets managed."
hermetictrader.com
hermetictrader.com
면책사항
해당 정보와 게시물은 금융, 투자, 트레이딩 또는 기타 유형의 조언이나 권장 사항으로 간주되지 않으며, 트레이딩뷰에서 제공하거나 보증하는 것이 아닙니다. 자세한 내용은 이용 약관을 참조하세요.
Hermetic Trader · "What gets measured gets managed."
hermetictrader.com
hermetictrader.com
면책사항
해당 정보와 게시물은 금융, 투자, 트레이딩 또는 기타 유형의 조언이나 권장 사항으로 간주되지 않으며, 트레이딩뷰에서 제공하거나 보증하는 것이 아닙니다. 자세한 내용은 이용 약관을 참조하세요.