OPEN-SOURCE SCRIPT
Altcoin Season Index [Dynamic Eras] | CriptoMatiko
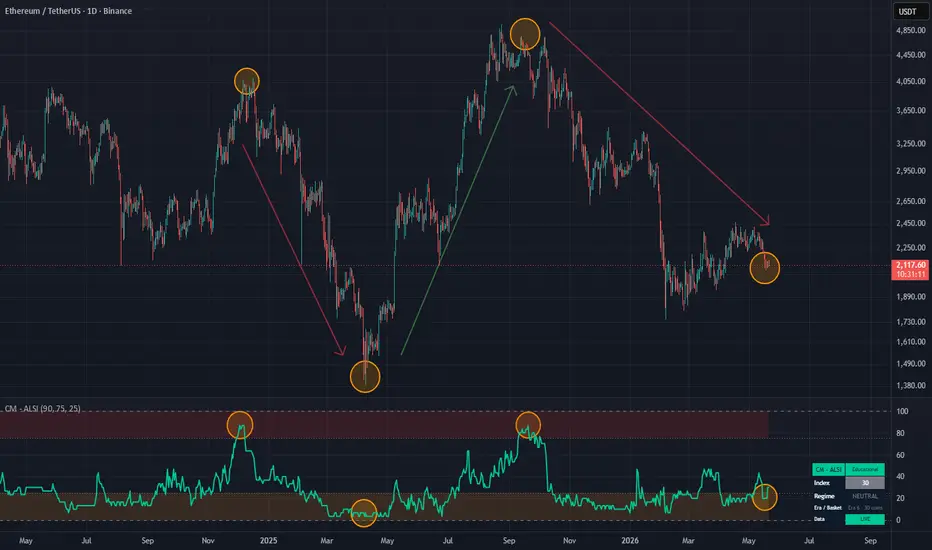
The Altcoin Season Index [Dynamic Eras] measures the percentage of top altcoins that have outperformed Bitcoin over a configurable rolling window (default: 90 days). Values above 75 indicate Altcoin Season; values below 25 indicate Bitcoin Season.
─────────────────────────────────────────────
WHAT MAKES THIS VERSION DIFFERENT
─────────────────────────────────────────────
Most Altcoin Season Index implementations use a fixed basket of coins evaluated against a static lookback window. This version solves two problems with that approach:
**1. Dynamic Eras — basket that reflects each market cycle**
The top altcoins in 2020 are not the same as in 2024. Including dead projects (LUNA, FTT) or irrelevant coins in later periods creates misleading signals. This script uses 6 time-based baskets:
- Era 1 (before Oct 2020): 20 coins — pre-DeFi legacy basket
- Era 2 (Oct 2020 – Oct 2021): 25 coins — DeFi Summer + Bull Run
- Era 3 (Oct 2021 – Oct 2022): 25 coins — Cycle top + early bear
- Era 4 (Oct 2022 – Oct 2023): 25 coins — Bear Market survivors
- Era 5 (Oct 2023 – Oct 2024): 30 coins — Recovery + ETF + Halving
- Era 6 (Oct 2024+): 30 coins — AI & Meme narrative leaders
**2. Variable denominator**
The denominator changes with each era (20 / 25 / 30) to match the actual basket size, keeping the 0–100 scale consistent and meaningful across all historical periods.
Total tracked assets: 40 (BTC + 39 altcoins across 5 tiers: established majors, DeFi, L2s, AI, Meme).
─────────────────────────────────────────────
TECHNICAL IMPLEMENTATION
─────────────────────────────────────────────
Performance for each asset is calculated WITHIN the daily context of request.security() — not on the chart's current timeframe. This ensures the 90-day rolling window always measures 90 calendar days, whether you are viewing a 1H or 1W chart. The calculation is: (close - close[win]) / close[win] * 100, evaluated daily.
─────────────────────────────────────────────
HOW TO READ IT
─────────────────────────────────────────────
- Above 75 → Altcoin Season: more than 75% of the active basket outperformed BTC in the last 90 days
- Below 25 → Bitcoin Season: Bitcoin dominates; most altcoins underperform
- 25–75 → Neutral: mixed conditions, no clear rotation signal
─────────────────────────────────────────────
INPUTS
─────────────────────────────────────────────
Model Settings:
- Comparison Window (days): rolling lookback period (default 90)
Regime Thresholds:
- Altcoin Season Threshold: upper boundary (default 75)
- Bitcoin Season Threshold: lower boundary (default 25)
Visual:
- Show Background Zones: highlights Altcoin Season and Bitcoin Season zones
- Show Status Table: toggles the bottom-right info panel
─────────────────────────────────────────────
STATUS TABLE
─────────────────────────────────────────────
- Index: current index value (0–100)
- Regime: ALTCOIN SEASON / NEUTRAL / BITCOIN SEASON
- Era / Basket: current era number and active coin count
- Data: LIVE when price feeds are connected, WAITING otherwise
─────────────────────────────────────────────
CHART ANNOTATIONS
─────────────────────────────────────────────
The circles on the lower pane mark historical extreme readings — index peaks above 75 (Altcoin Season) and troughs below 25 (Bitcoin Season). The arrows on the price chart illustrate the directional moves that followed those extremes, showing the historical correlation between extreme index readings and subsequent price reversals.
─────────────────────────────────────────────
NOTES
─────────────────────────────────────────────
Methodology inspired by the original Altcoin Season Index by BlockchainCenter.net. This is an independent open-source implementation with an expanded basket (40 assets vs the original 50 by market cap) and dynamic era logic.
For educational purposes only. Not financial advice.
─────────────────────────────────────────────
WHAT MAKES THIS VERSION DIFFERENT
─────────────────────────────────────────────
Most Altcoin Season Index implementations use a fixed basket of coins evaluated against a static lookback window. This version solves two problems with that approach:
**1. Dynamic Eras — basket that reflects each market cycle**
The top altcoins in 2020 are not the same as in 2024. Including dead projects (LUNA, FTT) or irrelevant coins in later periods creates misleading signals. This script uses 6 time-based baskets:
- Era 1 (before Oct 2020): 20 coins — pre-DeFi legacy basket
- Era 2 (Oct 2020 – Oct 2021): 25 coins — DeFi Summer + Bull Run
- Era 3 (Oct 2021 – Oct 2022): 25 coins — Cycle top + early bear
- Era 4 (Oct 2022 – Oct 2023): 25 coins — Bear Market survivors
- Era 5 (Oct 2023 – Oct 2024): 30 coins — Recovery + ETF + Halving
- Era 6 (Oct 2024+): 30 coins — AI & Meme narrative leaders
**2. Variable denominator**
The denominator changes with each era (20 / 25 / 30) to match the actual basket size, keeping the 0–100 scale consistent and meaningful across all historical periods.
Total tracked assets: 40 (BTC + 39 altcoins across 5 tiers: established majors, DeFi, L2s, AI, Meme).
─────────────────────────────────────────────
TECHNICAL IMPLEMENTATION
─────────────────────────────────────────────
Performance for each asset is calculated WITHIN the daily context of request.security() — not on the chart's current timeframe. This ensures the 90-day rolling window always measures 90 calendar days, whether you are viewing a 1H or 1W chart. The calculation is: (close - close[win]) / close[win] * 100, evaluated daily.
─────────────────────────────────────────────
HOW TO READ IT
─────────────────────────────────────────────
- Above 75 → Altcoin Season: more than 75% of the active basket outperformed BTC in the last 90 days
- Below 25 → Bitcoin Season: Bitcoin dominates; most altcoins underperform
- 25–75 → Neutral: mixed conditions, no clear rotation signal
─────────────────────────────────────────────
INPUTS
─────────────────────────────────────────────
Model Settings:
- Comparison Window (days): rolling lookback period (default 90)
Regime Thresholds:
- Altcoin Season Threshold: upper boundary (default 75)
- Bitcoin Season Threshold: lower boundary (default 25)
Visual:
- Show Background Zones: highlights Altcoin Season and Bitcoin Season zones
- Show Status Table: toggles the bottom-right info panel
─────────────────────────────────────────────
STATUS TABLE
─────────────────────────────────────────────
- Index: current index value (0–100)
- Regime: ALTCOIN SEASON / NEUTRAL / BITCOIN SEASON
- Era / Basket: current era number and active coin count
- Data: LIVE when price feeds are connected, WAITING otherwise
─────────────────────────────────────────────
CHART ANNOTATIONS
─────────────────────────────────────────────
The circles on the lower pane mark historical extreme readings — index peaks above 75 (Altcoin Season) and troughs below 25 (Bitcoin Season). The arrows on the price chart illustrate the directional moves that followed those extremes, showing the historical correlation between extreme index readings and subsequent price reversals.
─────────────────────────────────────────────
NOTES
─────────────────────────────────────────────
Methodology inspired by the original Altcoin Season Index by BlockchainCenter.net. This is an independent open-source implementation with an expanded basket (40 assets vs the original 50 by market cap) and dynamic era logic.
For educational purposes only. Not financial advice.
오픈 소스 스크립트
트레이딩뷰의 진정한 정신에 따라, 이 스크립트의 작성자는 이를 오픈소스로 공개하여 트레이더들이 기능을 검토하고 검증할 수 있도록 했습니다. 작성자에게 찬사를 보냅니다! 이 코드는 무료로 사용할 수 있지만, 코드를 재게시하는 경우 하우스 룰이 적용된다는 점을 기억하세요.

면책사항
해당 정보와 게시물은 금융, 투자, 트레이딩 또는 기타 유형의 조언이나 권장 사항으로 간주되지 않으며, 트레이딩뷰에서 제공하거나 보증하는 것이 아닙니다. 자세한 내용은 이용 약관을 참조하세요.
오픈 소스 스크립트
트레이딩뷰의 진정한 정신에 따라, 이 스크립트의 작성자는 이를 오픈소스로 공개하여 트레이더들이 기능을 검토하고 검증할 수 있도록 했습니다. 작성자에게 찬사를 보냅니다! 이 코드는 무료로 사용할 수 있지만, 코드를 재게시하는 경우 하우스 룰이 적용된다는 점을 기억하세요.
면책사항
해당 정보와 게시물은 금융, 투자, 트레이딩 또는 기타 유형의 조언이나 권장 사항으로 간주되지 않으며, 트레이딩뷰에서 제공하거나 보증하는 것이 아닙니다. 자세한 내용은 이용 약관을 참조하세요.