업데이트됨
Weekly & Daily Reference Levels
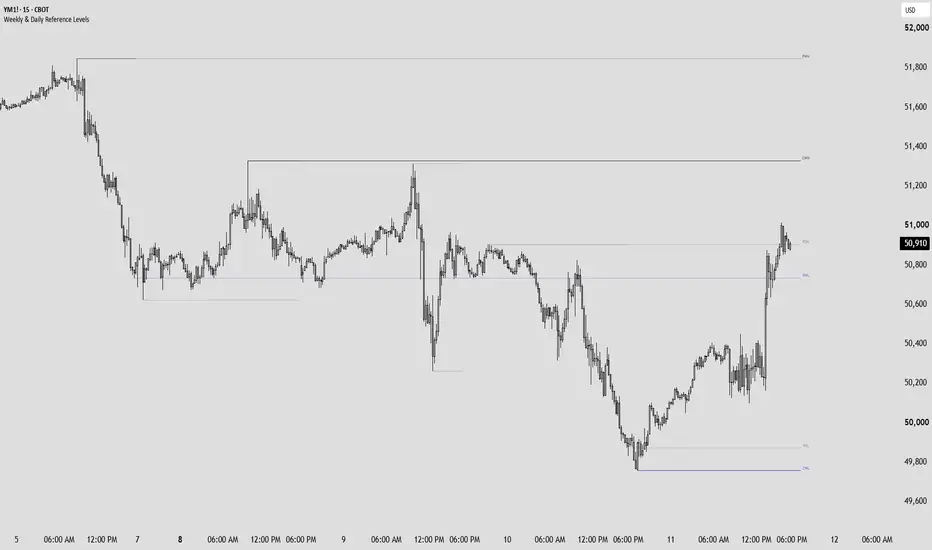
Weekly & Daily Reference Levels (ICT)
Plots and labels six key price reference levels drawn directly from ICT methodology — Current Week High/Low (CWH/CWL), Previous Week High/Low (PWH/PWL), and Previous Day High/Low (PDH/PDL) — giving you a clean, always-updated map of where liquidity is resting and where price has been engineered from.
CWH and CWL update live as the week develops, acting as your active buy-side and sell-side liquidity references. PWH and PWL lock at the weekly close and serve as the higher-timeframe draw targets framing the current week's range. PDH and PDL reset each day, giving you the prior session's engineered liquidity for the current trading day — the levels most likely to be swept before any meaningful directional move.
When two or more levels coincide within a configurable price threshold, their labels automatically merge into a single combined label — so instead of stacked text you get one clean read like CWH + PDH directly on the line. The moment those levels separate, the labels split back out independently. No overlaps, no clutter, no manual cleanup required.
Built to stay readable on a white background at any scalping timeframe from 1m to 15m. Solid lines for active levels, dotted for reference levels, and a strict one-label-per-line rule enforced throughout.
Displays: CWH · CWL · PWH · PWL · PDH · PDL — nothing else.
Enjoy. :)
Plots and labels six key price reference levels drawn directly from ICT methodology — Current Week High/Low (CWH/CWL), Previous Week High/Low (PWH/PWL), and Previous Day High/Low (PDH/PDL) — giving you a clean, always-updated map of where liquidity is resting and where price has been engineered from.
CWH and CWL update live as the week develops, acting as your active buy-side and sell-side liquidity references. PWH and PWL lock at the weekly close and serve as the higher-timeframe draw targets framing the current week's range. PDH and PDL reset each day, giving you the prior session's engineered liquidity for the current trading day — the levels most likely to be swept before any meaningful directional move.
When two or more levels coincide within a configurable price threshold, their labels automatically merge into a single combined label — so instead of stacked text you get one clean read like CWH + PDH directly on the line. The moment those levels separate, the labels split back out independently. No overlaps, no clutter, no manual cleanup required.
Built to stay readable on a white background at any scalping timeframe from 1m to 15m. Solid lines for active levels, dotted for reference levels, and a strict one-label-per-line rule enforced throughout.
Displays: CWH · CWL · PWH · PWL · PDH · PDL — nothing else.
Enjoy. :)
릴리즈 노트
{Logic Fix}릴리즈 노트
Clean look: week highs are dark grey and lows violet (were blue / red), and every line is width 1. Previous day levels stay black.PDH and PDL now stay on the chart once price closes through them, faded with their name kept, so the map keeps every level.
Labels unchanged.

면책사항
해당 정보와 게시물은 금융, 투자, 트레이딩 또는 기타 유형의 조언이나 권장 사항으로 간주되지 않으며, 트레이딩뷰에서 제공하거나 보증하는 것이 아닙니다. 자세한 내용은 이용 약관을 참조하세요.
면책사항
해당 정보와 게시물은 금융, 투자, 트레이딩 또는 기타 유형의 조언이나 권장 사항으로 간주되지 않으며, 트레이딩뷰에서 제공하거나 보증하는 것이 아닙니다. 자세한 내용은 이용 약관을 참조하세요.