OPEN-SOURCE SCRIPT
Volume Intensity Indicator
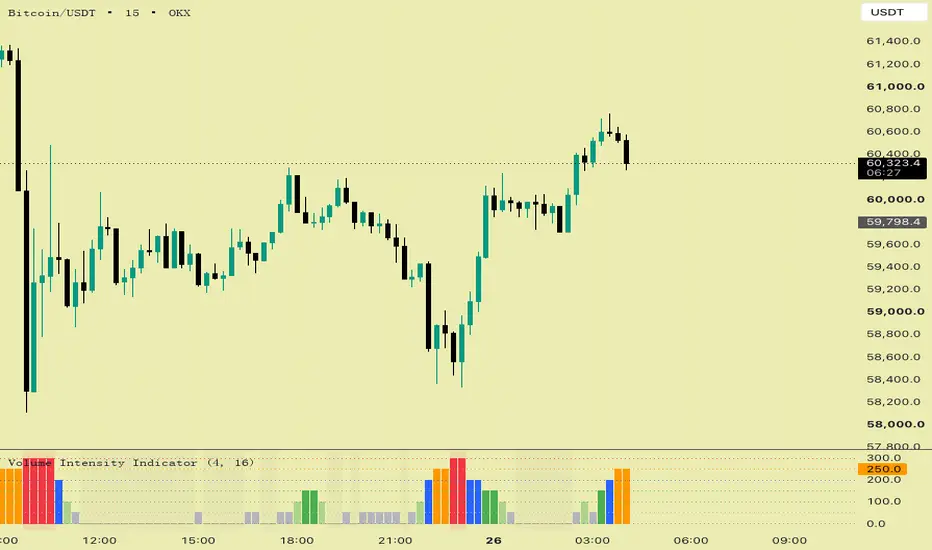
📊 Volume Intensity Indicator
🇺🇸 English
📌 Overview
This indicator measures relative trading volume strength by comparing short-term and long-term volume averages.
It converts raw volume into a 7-level intensity scale to help traders quickly understand whether market participation is weak, normal, increasing, or extremely strong.
🧠 How It Works
Fast Volume = short-term SMA of volume
Slow Volume = long-term SMA of volume
Volume Ratio = Fast Volume / Slow Volume
This ratio is classified into 7 levels (0–6).
📊 Volume Levels
Level 0 → Low Volume (consolidation / inactivity)
Level 1 → Normal Volume
Level 2 → Slight Increase
Level 3 → Moderate Increase
Level 4 → Strong Volume
Level 5 → High Volume (breakout interest)
Level 6 → Extreme Volume (news / panic / major move)
📌 How to Use
1. Trend Confirmation
Price up + Level 4–6 → strong trend
Price up + Level 0–2 → weak move / possible fake breakout
2. Breakout Validation
Level 5–6 → high probability of real breakout
Level 0–2 → likely false breakout
3. Market Condition
0–1 → low activity / range
3–6 → active market / volatility expansion
⚠️ Note
This indicator does NOT predict direction.
It only measures volume strength (market participation).
🇹🇼 中文
📌 概述
這個指標用來衡量成交量的相對強度,透過比較短期與長期成交量平均值,將成交量轉換為 7 個等級。
幫助交易者快速判斷市場是:
弱量、正常、放量、還是極端爆量。
🧠 運作方式
快線成交量 = 短期均量
慢線成交量 = 長期均量
成交量比值 = 快線 / 慢線
並將結果分成 0~6 等級。
📊 等級說明
0 → 縮量(盤整 / 無行情)
1 → 正常量
2 → 微放量
3 → 溫和放量
4 → 強勢放量
5 → 爆量(突破關注)
6 → 極端爆量(消息 / 情緒行情)
📌 使用方法
1️⃣ 判斷趨勢
上漲 + 4~6級 → 趨勢較可信
上漲 + 0~2級 → 容易是假突破
2️⃣ 判斷突破
5~6級突破 → 成功率較高
0~2級突破 → 容易失敗
3️⃣ 判斷市場狀態
0~1 → 盤整
3~6 → 波動放大
⚠️ 注意
此指標不判斷方向,只判斷強度。
用來觀察市場參與度,而不是預測漲跌。
🇺🇸 English
📌 Overview
This indicator measures relative trading volume strength by comparing short-term and long-term volume averages.
It converts raw volume into a 7-level intensity scale to help traders quickly understand whether market participation is weak, normal, increasing, or extremely strong.
🧠 How It Works
Fast Volume = short-term SMA of volume
Slow Volume = long-term SMA of volume
Volume Ratio = Fast Volume / Slow Volume
This ratio is classified into 7 levels (0–6).
📊 Volume Levels
Level 0 → Low Volume (consolidation / inactivity)
Level 1 → Normal Volume
Level 2 → Slight Increase
Level 3 → Moderate Increase
Level 4 → Strong Volume
Level 5 → High Volume (breakout interest)
Level 6 → Extreme Volume (news / panic / major move)
📌 How to Use
1. Trend Confirmation
Price up + Level 4–6 → strong trend
Price up + Level 0–2 → weak move / possible fake breakout
2. Breakout Validation
Level 5–6 → high probability of real breakout
Level 0–2 → likely false breakout
3. Market Condition
0–1 → low activity / range
3–6 → active market / volatility expansion
⚠️ Note
This indicator does NOT predict direction.
It only measures volume strength (market participation).
🇹🇼 中文
📌 概述
這個指標用來衡量成交量的相對強度,透過比較短期與長期成交量平均值,將成交量轉換為 7 個等級。
幫助交易者快速判斷市場是:
弱量、正常、放量、還是極端爆量。
🧠 運作方式
快線成交量 = 短期均量
慢線成交量 = 長期均量
成交量比值 = 快線 / 慢線
並將結果分成 0~6 等級。
📊 等級說明
0 → 縮量(盤整 / 無行情)
1 → 正常量
2 → 微放量
3 → 溫和放量
4 → 強勢放量
5 → 爆量(突破關注)
6 → 極端爆量(消息 / 情緒行情)
📌 使用方法
1️⃣ 判斷趨勢
上漲 + 4~6級 → 趨勢較可信
上漲 + 0~2級 → 容易是假突破
2️⃣ 判斷突破
5~6級突破 → 成功率較高
0~2級突破 → 容易失敗
3️⃣ 判斷市場狀態
0~1 → 盤整
3~6 → 波動放大
⚠️ 注意
此指標不判斷方向,只判斷強度。
用來觀察市場參與度,而不是預測漲跌。
오픈 소스 스크립트
트레이딩뷰의 진정한 정신에 따라, 이 스크립트의 작성자는 이를 오픈소스로 공개하여 트레이더들이 기능을 검토하고 검증할 수 있도록 했습니다. 작성자에게 찬사를 보냅니다! 이 코드는 무료로 사용할 수 있지만, 코드를 재게시하는 경우 하우스 룰이 적용된다는 점을 기억하세요.

輕輕得走過牛熊,用量化渡過長河
면책사항
해당 정보와 게시물은 금융, 투자, 트레이딩 또는 기타 유형의 조언이나 권장 사항으로 간주되지 않으며, 트레이딩뷰에서 제공하거나 보증하는 것이 아닙니다. 자세한 내용은 이용 약관을 참조하세요.
오픈 소스 스크립트
트레이딩뷰의 진정한 정신에 따라, 이 스크립트의 작성자는 이를 오픈소스로 공개하여 트레이더들이 기능을 검토하고 검증할 수 있도록 했습니다. 작성자에게 찬사를 보냅니다! 이 코드는 무료로 사용할 수 있지만, 코드를 재게시하는 경우 하우스 룰이 적용된다는 점을 기억하세요.
輕輕得走過牛熊,用量化渡過長河
면책사항
해당 정보와 게시물은 금융, 투자, 트레이딩 또는 기타 유형의 조언이나 권장 사항으로 간주되지 않으며, 트레이딩뷰에서 제공하거나 보증하는 것이 아닙니다. 자세한 내용은 이용 약관을 참조하세요.