업데이트됨
HTF Candle Box [rare_gold_steak]
See the bigger picture
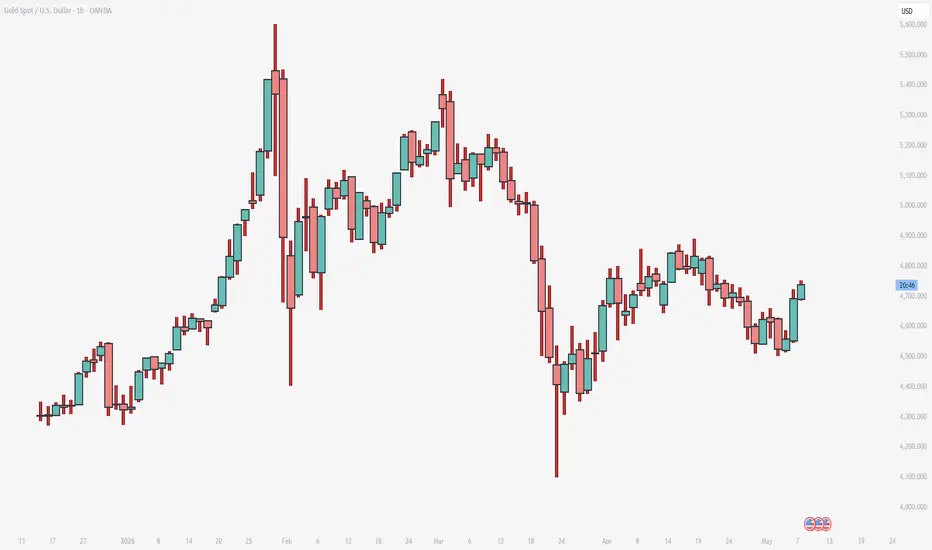
This indicator will overlay higher timeframe candles directly on your chart, so you can see the structure far more clearly. Whether you're on 1H showing 1D candles, or on 1D showing Weekly candles, it will make price easier to read at a glance
Plots the box as a normal candle would:
Everything is customizable. Enjoy
This indicator will overlay higher timeframe candles directly on your chart, so you can see the structure far more clearly. Whether you're on 1H showing 1D candles, or on 1D showing Weekly candles, it will make price easier to read at a glance
Plots the box as a normal candle would:
- Open — where price started the day
- Close — where price ended the day
- High — highest point reached
- Low — lowest point reached
Everything is customizable. Enjoy
릴리즈 노트
Updated to show GREEN/RED candles on default. Can be turned off in the settings.
면책사항
해당 정보와 게시물은 금융, 투자, 트레이딩 또는 기타 유형의 조언이나 권장 사항으로 간주되지 않으며, 트레이딩뷰에서 제공하거나 보증하는 것이 아닙니다. 자세한 내용은 이용 약관을 참조하세요.
면책사항
해당 정보와 게시물은 금융, 투자, 트레이딩 또는 기타 유형의 조언이나 권장 사항으로 간주되지 않으며, 트레이딩뷰에서 제공하거나 보증하는 것이 아닙니다. 자세한 내용은 이용 약관을 참조하세요.