OPEN-SOURCE SCRIPT
Initial Balance Breaks [NQ stats x CantoLab]
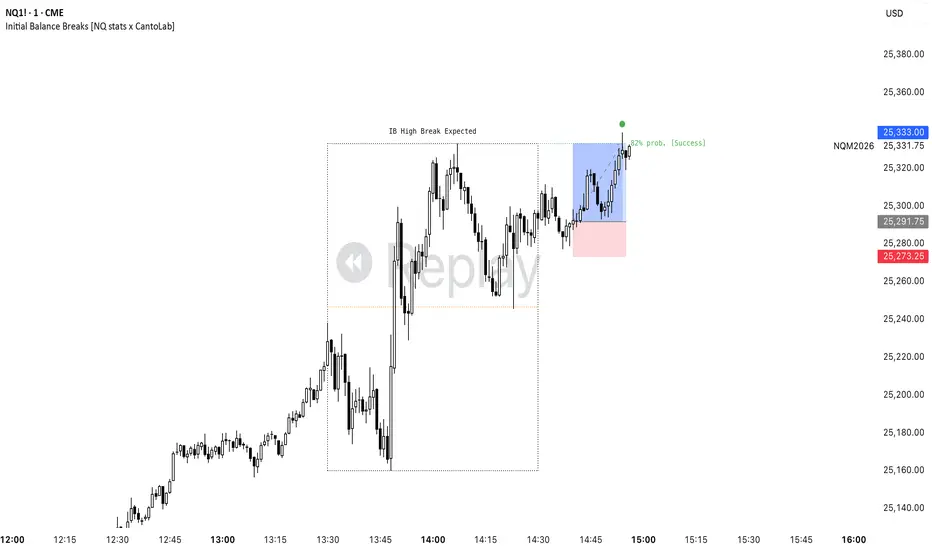
An open source indicator built around the Initial Balance break statistics from NQ Stats (nqstats.com). Credit to NQ Stats for the original research — published here with permission.
⚠️ Important
This is a statistical study indicator. It does not guarantee that the IB high or low will be hit. Over a large sample, this is the expected behaviour based on 10 years of NQ data. It is best combined with other confluences to confirm direction — this indicator alone is not a strategy.
What is the Initial Balance?
The Initial Balance (IB) is the price range established during the first hour of the New York equity session — 09:30 to 10:30 ET. The high and low set within this window become key levels for the rest of the trading day.
Based on 10 years of NQ data, IB breaks 83% of the time before noon and 96% of the time before 4:00 PM. The stat alone doesn't give you direction — but combined with where the IB closes relative to its own midpoint, you get a directional edge:
IB closes in the upper half → high breaks 82% of the time
IB closes in the lower half → low breaks 76% of the time
What it does
Once the IB window closes at 10:30, the indicator plots the IB High, Low and Mid as levels on the chart and automatically determines the directional bias based on where price closed within the IB range.
The expected break side is labelled with its probability and a tracking line extends forward tracking whether that level gets hit. When the level is breached the label updates to show Success or Failed in real time.
IB High — upper boundary of the initial balance range
IB Low — lower boundary of the initial balance range
IB Mid — equilibrium of the range, plotted in orange.
When price closes above mid, high break is expected.
When price close below mid, low break is expected.
Probability line — extends from IB close forward on the expected side, updates to Success or Failed when hit
Settings
Notes
⚠️ Important
This is a statistical study indicator. It does not guarantee that the IB high or low will be hit. Over a large sample, this is the expected behaviour based on 10 years of NQ data. It is best combined with other confluences to confirm direction — this indicator alone is not a strategy.
What is the Initial Balance?
The Initial Balance (IB) is the price range established during the first hour of the New York equity session — 09:30 to 10:30 ET. The high and low set within this window become key levels for the rest of the trading day.
Based on 10 years of NQ data, IB breaks 83% of the time before noon and 96% of the time before 4:00 PM. The stat alone doesn't give you direction — but combined with where the IB closes relative to its own midpoint, you get a directional edge:
IB closes in the upper half → high breaks 82% of the time
IB closes in the lower half → low breaks 76% of the time
What it does
Once the IB window closes at 10:30, the indicator plots the IB High, Low and Mid as levels on the chart and automatically determines the directional bias based on where price closed within the IB range.
The expected break side is labelled with its probability and a tracking line extends forward tracking whether that level gets hit. When the level is breached the label updates to show Success or Failed in real time.
IB High — upper boundary of the initial balance range
IB Low — lower boundary of the initial balance range
IB Mid — equilibrium of the range, plotted in orange.
When price closes above mid, high break is expected.
When price close below mid, low break is expected.
Probability line — extends from IB close forward on the expected side, updates to Success or Failed when hit
Settings
- IB Time — configurable session window, default 09:30–10:30 NY time
- Label Size — Tiny / Small / Normal / Large / Huge
- Per-level line style and width — IB High, Low, Mid and vertical markers
- Auto color — IB High and Low auto-adapt to chart theme, or set manually
Notes
- Built for NQ Futures. Behaviour on other instruments is untested
- All times are New York time
- Current version tracks directional bias from IB close relative to midpoint. The 83% before noon and 96% before 4PM time-based breach tracking and IB formation order confluence are not yet implemented
- Probability data derived from 10 years of NQ historical data by NQ Stats.
- This indicator does not provide financial advice or a complete strategy. You are responsible for how you build around and execute on this data
오픈 소스 스크립트
트레이딩뷰의 진정한 정신에 따라, 이 스크립트의 작성자는 이를 오픈소스로 공개하여 트레이더들이 기능을 검토하고 검증할 수 있도록 했습니다. 작성자에게 찬사를 보냅니다! 이 코드는 무료로 사용할 수 있지만, 코드를 재게시하는 경우 하우스 룰이 적용된다는 점을 기억하세요.

면책사항
해당 정보와 게시물은 금융, 투자, 트레이딩 또는 기타 유형의 조언이나 권장 사항으로 간주되지 않으며, 트레이딩뷰에서 제공하거나 보증하는 것이 아닙니다. 자세한 내용은 이용 약관을 참조하세요.
오픈 소스 스크립트
트레이딩뷰의 진정한 정신에 따라, 이 스크립트의 작성자는 이를 오픈소스로 공개하여 트레이더들이 기능을 검토하고 검증할 수 있도록 했습니다. 작성자에게 찬사를 보냅니다! 이 코드는 무료로 사용할 수 있지만, 코드를 재게시하는 경우 하우스 룰이 적용된다는 점을 기억하세요.
면책사항
해당 정보와 게시물은 금융, 투자, 트레이딩 또는 기타 유형의 조언이나 권장 사항으로 간주되지 않으며, 트레이딩뷰에서 제공하거나 보증하는 것이 아닙니다. 자세한 내용은 이용 약관을 참조하세요.