MonoIntel Settlements: Previous Day and Week Settlement
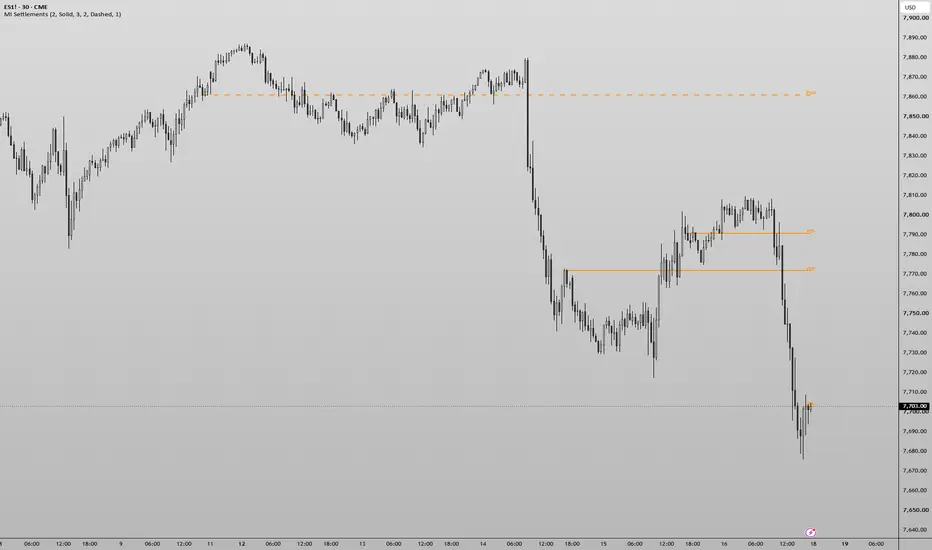
This indicator plots two horizontal reference lines: the previous day's and the previous week's 16:00 New York close.
How it works. Times are fixed to New York time. PDS is the last traded price at or before 16:00 on the previous trading day. On early-close days it is that day's last traded price. PWS is the same price on the previous Friday. Both are taken from the chart symbol. They mark the 16:00 New York close for every market, not the exchange's official settlement price. From the Sunday open to Monday's close, PDS shows Friday's close, the same price as PWS. A new PWS line is drawn once a week, at the Sunday open. Lines start at the bar that made the close, extend right and are labelled PDS and PWS.
What is different. Daily-bar tools take the close from the symbol's daily bar. This script reads the 16:00 price from intraday bars, keeps a set number of past levels, and can hide levels that price has traded back through after the next session opens.
Inputs. For each line: show or hide, colour, width, style, history (1 to 20), and "Show outstanding only".
Use. For index futures and similar 24-hour markets on charts from 1 minute to 4 hours. Nothing is drawn above 4 hours. Reference levels only.
How it works. Times are fixed to New York time. PDS is the last traded price at or before 16:00 on the previous trading day. On early-close days it is that day's last traded price. PWS is the same price on the previous Friday. Both are taken from the chart symbol. They mark the 16:00 New York close for every market, not the exchange's official settlement price. From the Sunday open to Monday's close, PDS shows Friday's close, the same price as PWS. A new PWS line is drawn once a week, at the Sunday open. Lines start at the bar that made the close, extend right and are labelled PDS and PWS.
What is different. Daily-bar tools take the close from the symbol's daily bar. This script reads the 16:00 price from intraday bars, keeps a set number of past levels, and can hide levels that price has traded back through after the next session opens.
Inputs. For each line: show or hide, colour, width, style, history (1 to 20), and "Show outstanding only".
Use. For index futures and similar 24-hour markets on charts from 1 minute to 4 hours. Nothing is drawn above 4 hours. Reference levels only.

1% better a day, 365% better a year.
면책사항
해당 정보와 게시물은 금융, 투자, 트레이딩 또는 기타 유형의 조언이나 권장 사항으로 간주되지 않으며, 트레이딩뷰에서 제공하거나 보증하는 것이 아닙니다. 자세한 내용은 이용 약관을 참조하세요.
1% better a day, 365% better a year.
면책사항
해당 정보와 게시물은 금융, 투자, 트레이딩 또는 기타 유형의 조언이나 권장 사항으로 간주되지 않으며, 트레이딩뷰에서 제공하거나 보증하는 것이 아닙니다. 자세한 내용은 이용 약관을 참조하세요.