OPEN-SOURCE SCRIPT
RTH Previous Day Levels | VAH VAL POC PDH PDL
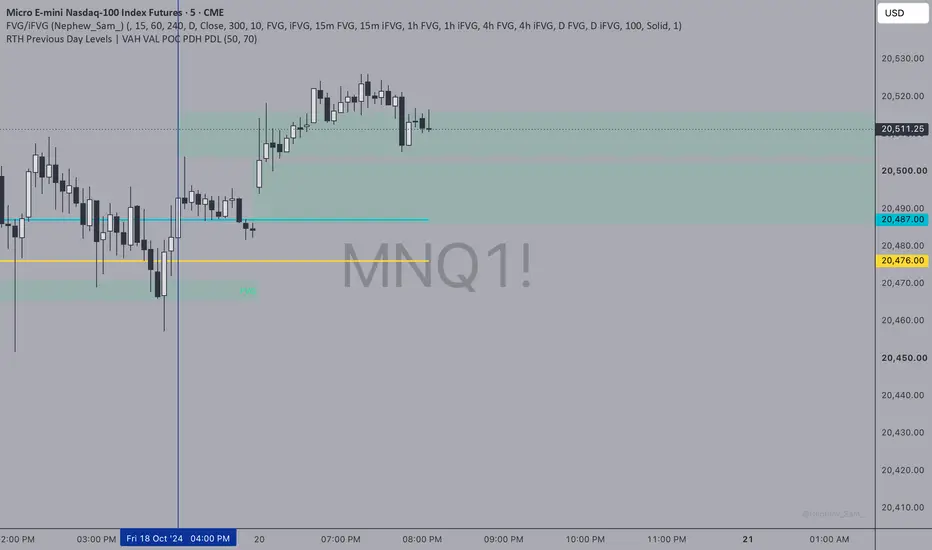
# Previous Day RTH Levels | VAH, VAL, POC, PDH & PDL
This indicator automatically plots five key price levels from the previous trading day's Regular Trading Hours (RTH) session, helping traders identify important areas of support, resistance, liquidity, and potential price acceptance or rejection.
Designed primarily for Nasdaq futures (NQ/MNQ), the indicator uses the New York RTH session (9:30 AM–4:00 PM ET).
### Key Features
- **PDH (Previous Day High):** The highest price reached during the previous RTH session.
- **PDL (Previous Day Low):** The lowest price reached during the previous RTH session.
- **VAH (Value Area High):** The upper boundary of the calculated value area.
- **VAL (Value Area Low):** The lower boundary of the calculated value area.
- **POC (Point of Control):** The price level with the highest estimated trading volume.
### Customization
- Individually enable or disable all five levels.
- Adjust volume profile resolution.
- Customize the value area percentage (70% default).
- Automatically updates levels for each new trading session.
### Trading Applications
Useful for identifying liquidity sweeps, breakouts, reversals, support and resistance, and price acceptance or rejection around previous-session levels.
### Important Notes
Volume profile levels are calculated using an estimated distribution of candle volume across price ranges. Results may differ from TradingView's built-in Volume Profile tools.
Designed for intraday charts, particularly the 5-minute timeframe.
**Disclaimer:** This indicator is intended for educational and technical analysis purposes only. It does not generate buy or sell signals and should not be considered financial advice.
This indicator automatically plots five key price levels from the previous trading day's Regular Trading Hours (RTH) session, helping traders identify important areas of support, resistance, liquidity, and potential price acceptance or rejection.
Designed primarily for Nasdaq futures (NQ/MNQ), the indicator uses the New York RTH session (9:30 AM–4:00 PM ET).
### Key Features
- **PDH (Previous Day High):** The highest price reached during the previous RTH session.
- **PDL (Previous Day Low):** The lowest price reached during the previous RTH session.
- **VAH (Value Area High):** The upper boundary of the calculated value area.
- **VAL (Value Area Low):** The lower boundary of the calculated value area.
- **POC (Point of Control):** The price level with the highest estimated trading volume.
### Customization
- Individually enable or disable all five levels.
- Adjust volume profile resolution.
- Customize the value area percentage (70% default).
- Automatically updates levels for each new trading session.
### Trading Applications
Useful for identifying liquidity sweeps, breakouts, reversals, support and resistance, and price acceptance or rejection around previous-session levels.
### Important Notes
Volume profile levels are calculated using an estimated distribution of candle volume across price ranges. Results may differ from TradingView's built-in Volume Profile tools.
Designed for intraday charts, particularly the 5-minute timeframe.
**Disclaimer:** This indicator is intended for educational and technical analysis purposes only. It does not generate buy or sell signals and should not be considered financial advice.
오픈 소스 스크립트
트레이딩뷰의 진정한 정신에 따라, 이 스크립트의 작성자는 이를 오픈소스로 공개하여 트레이더들이 기능을 검토하고 검증할 수 있도록 했습니다. 작성자에게 찬사를 보냅니다! 이 코드는 무료로 사용할 수 있지만, 코드를 재게시하는 경우 하우스 룰이 적용된다는 점을 기억하세요.

면책사항
해당 정보와 게시물은 금융, 투자, 트레이딩 또는 기타 유형의 조언이나 권장 사항으로 간주되지 않으며, 트레이딩뷰에서 제공하거나 보증하는 것이 아닙니다. 자세한 내용은 이용 약관을 참조하세요.
오픈 소스 스크립트
트레이딩뷰의 진정한 정신에 따라, 이 스크립트의 작성자는 이를 오픈소스로 공개하여 트레이더들이 기능을 검토하고 검증할 수 있도록 했습니다. 작성자에게 찬사를 보냅니다! 이 코드는 무료로 사용할 수 있지만, 코드를 재게시하는 경우 하우스 룰이 적용된다는 점을 기억하세요.
면책사항
해당 정보와 게시물은 금융, 투자, 트레이딩 또는 기타 유형의 조언이나 권장 사항으로 간주되지 않으며, 트레이딩뷰에서 제공하거나 보증하는 것이 아닙니다. 자세한 내용은 이용 약관을 참조하세요.