OPEN-SOURCE SCRIPT
업데이트됨 OS RSI Envelope
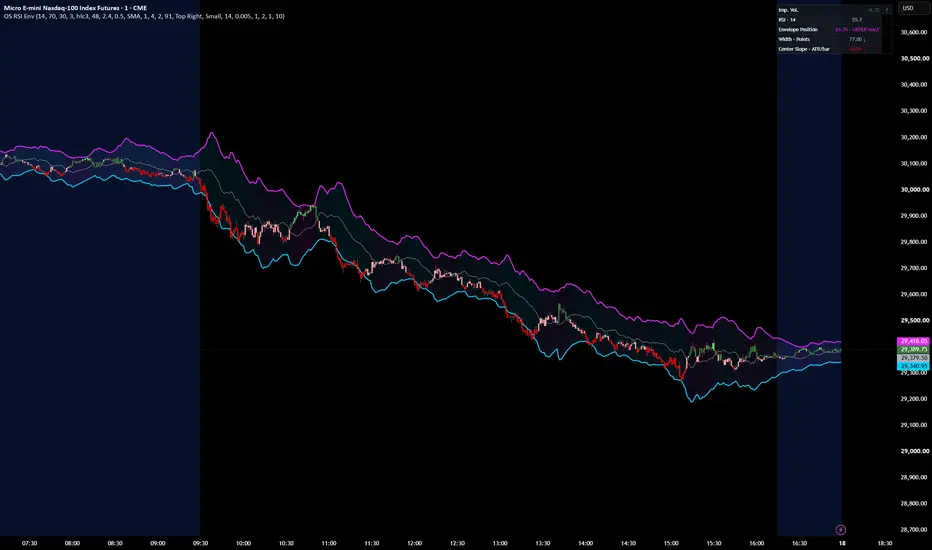
RSI Envelope
The OS RSI Envelope projects dynamic price boundaries where the selected RSI would reach its upper or lower threshold.
With the default 14-period RSI and 70/30 thresholds, the upper boundary represents the price level associated with RSI reaching 70, and the lower boundary represents the level associated with RSI reaching 30.
The boundaries adapt as recent upward and downward price movement changes.
Light smoothing can make them easier to read.
This is a price overlay, not a traditional volatility band.
Its boundaries provide context for where price sits relative to RSI pressure levels; they do not predict reversals or guarantee that price will turn.
How to interpret it
- Between the boundaries: Price is inside the envelope. Its dashboard position shows where it sits: 0% at the lower boundary, 50% at the center, and 100% at the upper boundary.
- Below 0% or above 100%: Price is outside the envelope. This marks movement beyond the projected RSI threshold level; it is not, by itself, a reversal signal.
- Envelope width: The distance between the upper and lower boundaries in price points. Widening means that distance is increasing; narrowing means it is decreasing.
- Center slope: The envelope midpoint’s one-bar change divided by ATR. The arrow and color show whether the midpoint is rising, falling, or relatively flat.
In a strong trend, price can stay near or beyond a boundary. Read the envelope alongside price action and other context; don’t treat a boundary touch alone as a buy or sell signal.
릴리즈 노트
Updated Impulse Volume CandlesImpulse Volume calculations and candle-color logic adapted from [Impulse Volume Oscillator by AlphaExtract](tradingview.com/script/toO8ErhY-Impulse-Volume-Oscillator-Alpha-Extract/). Licensed under the Mozilla Public License 2.0. Integrated and modified for OS Market Compass.
오픈 소스 스크립트
트레이딩뷰의 진정한 정신에 따라, 이 스크립트의 작성자는 이를 오픈소스로 공개하여 트레이더들이 기능을 검토하고 검증할 수 있도록 했습니다. 작성자에게 찬사를 보냅니다! 이 코드는 무료로 사용할 수 있지만, 코드를 재게시하는 경우 하우스 룰이 적용된다는 점을 기억하세요.

면책사항
해당 정보와 게시물은 금융, 투자, 트레이딩 또는 기타 유형의 조언이나 권장 사항으로 간주되지 않으며, 트레이딩뷰에서 제공하거나 보증하는 것이 아닙니다. 자세한 내용은 이용 약관을 참조하세요.
오픈 소스 스크립트
트레이딩뷰의 진정한 정신에 따라, 이 스크립트의 작성자는 이를 오픈소스로 공개하여 트레이더들이 기능을 검토하고 검증할 수 있도록 했습니다. 작성자에게 찬사를 보냅니다! 이 코드는 무료로 사용할 수 있지만, 코드를 재게시하는 경우 하우스 룰이 적용된다는 점을 기억하세요.
면책사항
해당 정보와 게시물은 금융, 투자, 트레이딩 또는 기타 유형의 조언이나 권장 사항으로 간주되지 않으며, 트레이딩뷰에서 제공하거나 보증하는 것이 아닙니다. 자세한 내용은 이용 약관을 참조하세요.