OPEN-SOURCE SCRIPT
업데이트됨 TPI 15m ONLY
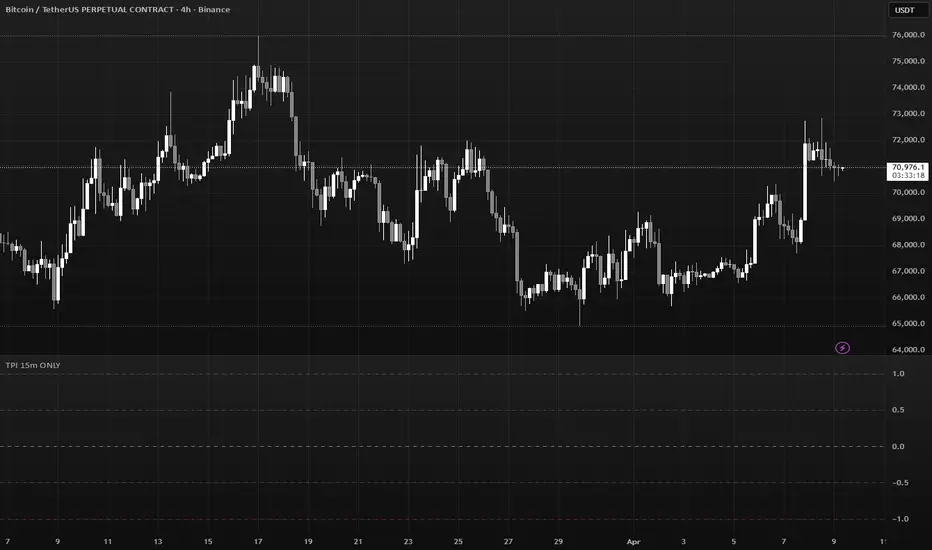
TPI (Trend Power Index) is a multi-factor momentum and structure indicator designed to measure overall market bias using trend structure, momentum, and moving averages.
The script combines six independent components into one normalized score between -1 and +1, giving a quick visual overview of bullish or bearish strength.
The indicator is optimized to work with 15 minute trading, while also incorporating higher timeframe structure.
Core Components
1. Multi-Timeframe Market Structure (BOS / MSB)
The script builds dynamic swing highs and swing lows and detects:
BOS (Break of Structure)
MSB (Market Structure Break)
These signals determine the trend direction on:
4H
1H
15M
Each timeframe contributes to the final trend score.
2. Supertrend Bias (30m)
A 30 minute Supertrend is used as a higher timeframe trend filter.
Price above Supertrend → Bullish score
Price below Supertrend → Bearish score
3. TSI Momentum (15m)
A True Strength Index measures momentum strength.
Conditions used:
TSI above signal line
TSI above or below zero
This creates graded momentum scoring.
4. EMA Structure (15m)
Two EMAs are used:
EMA 18
EMA 36
Scoring depends on:
EMA alignment
Price position relative to both EMAs
This captures short-term directional pressure.
Final TPI Calculation
All components are averaged:
TPI = (4H trend + 1H trend + 15M trend + TSI + EMA + Supertrend) / 6
The result is a continuous score between -1 and +1.
Visualization
The indicator plots colored dots representing trend strength.
Color intensity reflects the magnitude of the TPI score:
Dark Green → Strong bullish alignment
Light Green → Mild bullish bias
Gray → Neutral / mixed signals
Light Red → Mild bearish bias
Dark Red → Strong bearish alignment
Horizontal reference levels:
+1.0 → Maximum bullish alignment
+0.5 → Moderate bullish bias
0.0 → Neutral
-0.5 → Moderate bearish bias
-1.0 → Maximum bearish alignment
Intended Use
TPI is designed to help traders quickly identify:
Market alignment across timeframes
Momentum confirmation
Trend strength
Potential trend transitions
It works well as a trend filter, bias indicator, or confirmation tool for discretionary strategies.
The script combines six independent components into one normalized score between -1 and +1, giving a quick visual overview of bullish or bearish strength.
The indicator is optimized to work with 15 minute trading, while also incorporating higher timeframe structure.
Core Components
1. Multi-Timeframe Market Structure (BOS / MSB)
The script builds dynamic swing highs and swing lows and detects:
BOS (Break of Structure)
MSB (Market Structure Break)
These signals determine the trend direction on:
4H
1H
15M
Each timeframe contributes to the final trend score.
2. Supertrend Bias (30m)
A 30 minute Supertrend is used as a higher timeframe trend filter.
Price above Supertrend → Bullish score
Price below Supertrend → Bearish score
3. TSI Momentum (15m)
A True Strength Index measures momentum strength.
Conditions used:
TSI above signal line
TSI above or below zero
This creates graded momentum scoring.
4. EMA Structure (15m)
Two EMAs are used:
EMA 18
EMA 36
Scoring depends on:
EMA alignment
Price position relative to both EMAs
This captures short-term directional pressure.
Final TPI Calculation
All components are averaged:
TPI = (4H trend + 1H trend + 15M trend + TSI + EMA + Supertrend) / 6
The result is a continuous score between -1 and +1.
Visualization
The indicator plots colored dots representing trend strength.
Color intensity reflects the magnitude of the TPI score:
Dark Green → Strong bullish alignment
Light Green → Mild bullish bias
Gray → Neutral / mixed signals
Light Red → Mild bearish bias
Dark Red → Strong bearish alignment
Horizontal reference levels:
+1.0 → Maximum bullish alignment
+0.5 → Moderate bullish bias
0.0 → Neutral
-0.5 → Moderate bearish bias
-1.0 → Maximum bearish alignment
Intended Use
TPI is designed to help traders quickly identify:
Market alignment across timeframes
Momentum confirmation
Trend strength
Potential trend transitions
It works well as a trend filter, bias indicator, or confirmation tool for discretionary strategies.
릴리즈 노트
.릴리즈 노트
Contact me in private if you need the indicator릴리즈 노트
Contact me in private if you need the indicator오픈 소스 스크립트
트레이딩뷰의 진정한 정신에 따라, 이 스크립트의 작성자는 이를 오픈소스로 공개하여 트레이더들이 기능을 검토하고 검증할 수 있도록 했습니다. 작성자에게 찬사를 보냅니다! 이 코드는 무료로 사용할 수 있지만, 코드를 재게시하는 경우 하우스 룰이 적용된다는 점을 기억하세요.

면책사항
해당 정보와 게시물은 금융, 투자, 트레이딩 또는 기타 유형의 조언이나 권장 사항으로 간주되지 않으며, 트레이딩뷰에서 제공하거나 보증하는 것이 아닙니다. 자세한 내용은 이용 약관을 참조하세요.
오픈 소스 스크립트
트레이딩뷰의 진정한 정신에 따라, 이 스크립트의 작성자는 이를 오픈소스로 공개하여 트레이더들이 기능을 검토하고 검증할 수 있도록 했습니다. 작성자에게 찬사를 보냅니다! 이 코드는 무료로 사용할 수 있지만, 코드를 재게시하는 경우 하우스 룰이 적용된다는 점을 기억하세요.
면책사항
해당 정보와 게시물은 금융, 투자, 트레이딩 또는 기타 유형의 조언이나 권장 사항으로 간주되지 않으며, 트레이딩뷰에서 제공하거나 보증하는 것이 아닙니다. 자세한 내용은 이용 약관을 참조하세요.