MonoIntel Session Framework
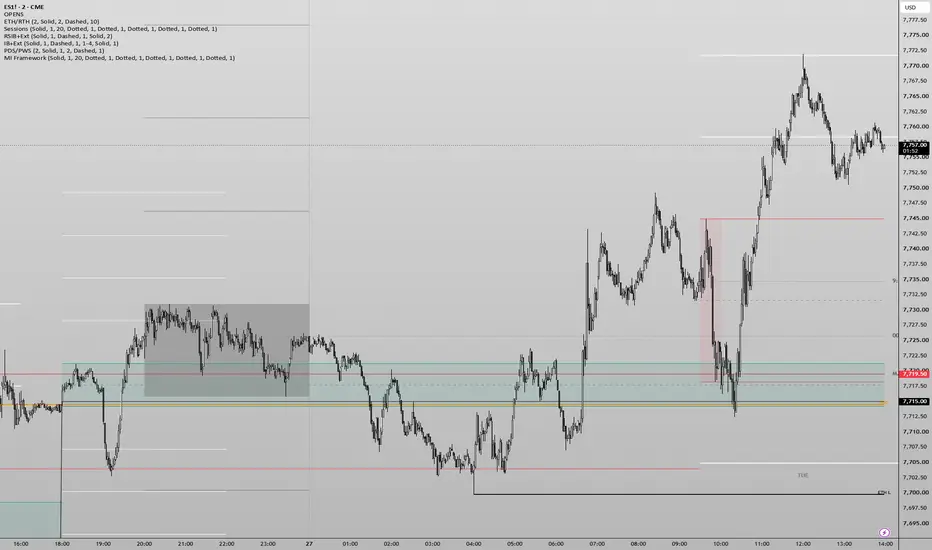
This indicator adds a time framework to an intraday chart: the Asia range, four opening prices and day dividers. All times are New York time.
Asia range. The script tracks the high and low from 20:00 to midnight. At midnight it draws a shaded box over that range. It also draws eight short lines at one, two, three and four times the range, above the high and below the low. The settings call these SD lines. Each one is a multiple of the Asia range. Up to 50 past sessions are kept (default 20).
Open lines. Midnight open (00:00), RTH open (09:30), weekly open and monthly open. Each is a horizontal line from the opening bar to the current bar, with a tag. Only the current period's line is shown. On timeframes where 00:00 or 09:30 falls inside a bar, the prices and the Asia range are read from finer data, so they stay exact.
Day dividers. A vertical line at each midnight, and the day name at the bottom of the chart.
What is different. It gathers these references in one overlay, on one time zone, with exact open prices on any intraday timeframe.
Inputs. Each element can be shown or hidden, with its own style and width. Colours are set per group.
Use. For charts of one hour or lower. Nothing is drawn above that. Reference lines only.
Asia range. The script tracks the high and low from 20:00 to midnight. At midnight it draws a shaded box over that range. It also draws eight short lines at one, two, three and four times the range, above the high and below the low. The settings call these SD lines. Each one is a multiple of the Asia range. Up to 50 past sessions are kept (default 20).
Open lines. Midnight open (00:00), RTH open (09:30), weekly open and monthly open. Each is a horizontal line from the opening bar to the current bar, with a tag. Only the current period's line is shown. On timeframes where 00:00 or 09:30 falls inside a bar, the prices and the Asia range are read from finer data, so they stay exact.
Day dividers. A vertical line at each midnight, and the day name at the bottom of the chart.
What is different. It gathers these references in one overlay, on one time zone, with exact open prices on any intraday timeframe.
Inputs. Each element can be shown or hidden, with its own style and width. Colours are set per group.
Use. For charts of one hour or lower. Nothing is drawn above that. Reference lines only.

1% better a day, 365% better a year.
면책사항
해당 정보와 게시물은 금융, 투자, 트레이딩 또는 기타 유형의 조언이나 권장 사항으로 간주되지 않으며, 트레이딩뷰에서 제공하거나 보증하는 것이 아닙니다. 자세한 내용은 이용 약관을 참조하세요.
1% better a day, 365% better a year.
면책사항
해당 정보와 게시물은 금융, 투자, 트레이딩 또는 기타 유형의 조언이나 권장 사항으로 간주되지 않으며, 트레이딩뷰에서 제공하거나 보증하는 것이 아닙니다. 자세한 내용은 이용 약관을 참조하세요.