Portfolio tracker: basket return on average cost vs BTC
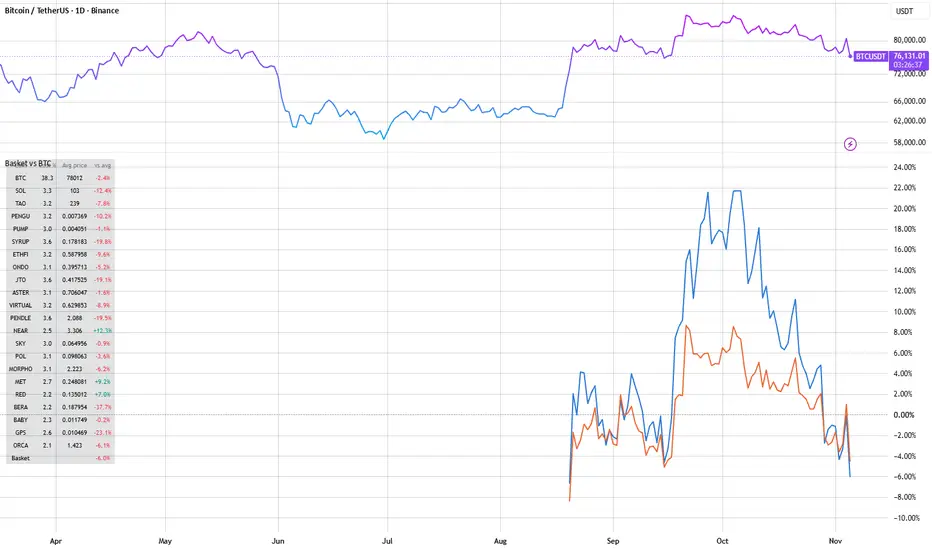
This script tracks a multi-coin spot portfolio live on any chart: it shows what the current holdings are worth against what they cost, and compares that with having put the same money into BTC only.
What it plots
1. Basket return on cost (blue): for every coin, the current price divided by its average purchase price, weighted by that coin's share of the total cost. This is the unrealised return of the holdings.
2. BTC only, same cash flows (orange): the return of BTC against a single benchmark entry price, the average price you would have paid if every purchase had gone into BTC on the same dates.
The table lists each coin with its share of cost, its average price and its return against that average, plus the basket total.
Default inputs. The defaults are the BICAPITAL 40/60 crypto portfolio as of 5 November 2026: 40% BTC and 60% split equally across 21 altcoins, with the real share of cost and average price of each coin. At publication the basket was at -5.9% on cost and the BTC benchmark at -4.3%: spreading into altcoins has so far cost about 1.6 points against holding BTC alone. The same history shows the basket 21.3% up against 6.8% for BTC on 6 October, a lead that the October fall erased. When the portfolio is rebalanced, the script will be updated with the new inputs.
Use it for your own portfolio. Replace the 22 rows (symbol, share of cost in %, average price) with your holdings. Unused rows can be set to a share of 0. Row 1 is used for the BTC benchmark. Shares do not need to add up to 100: the script normalises them.
Notes and limitations
- The line before today assumes today's holdings, so it shows how the current basket would have looked at earlier prices, not the historical account value.
- Realised profits or losses from past sales are not included.
- Prices are spot closes on Binance; works on any timeframe, daily is the natural one.
- Coins that did not exist yet are left out of the average on those bars.
Educational tool. Not investment advice. Own capital; this is not an offer or portfolio management for third parties.
---
ES
Seguimiento de cartera: rendimiento sobre el precio medio frente a BTC. El script sigue en vivo una cartera spot de varias monedas: cuánto valen hoy las posiciones frente a lo que costaron, y cómo se compara con haber puesto el mismo dinero solo en BTC. Los valores por defecto son la cartera 40/60 de BICAPITAL al 5 de noviembre de 2026 (40 % BTC y 60 % repartido entre 21 alts, con la parte del coste y el precio medio reales de cada moneda). Al publicar, la cartera iba −5,9 % sobre el coste y BTC con los mismos flujos −4,3 %. Se puede usar con cualquier cartera cambiando las 22 filas. Herramienta educativa; no es asesoría de inversión.
What it plots
1. Basket return on cost (blue): for every coin, the current price divided by its average purchase price, weighted by that coin's share of the total cost. This is the unrealised return of the holdings.
2. BTC only, same cash flows (orange): the return of BTC against a single benchmark entry price, the average price you would have paid if every purchase had gone into BTC on the same dates.
The table lists each coin with its share of cost, its average price and its return against that average, plus the basket total.
Default inputs. The defaults are the BICAPITAL 40/60 crypto portfolio as of 5 November 2026: 40% BTC and 60% split equally across 21 altcoins, with the real share of cost and average price of each coin. At publication the basket was at -5.9% on cost and the BTC benchmark at -4.3%: spreading into altcoins has so far cost about 1.6 points against holding BTC alone. The same history shows the basket 21.3% up against 6.8% for BTC on 6 October, a lead that the October fall erased. When the portfolio is rebalanced, the script will be updated with the new inputs.
Use it for your own portfolio. Replace the 22 rows (symbol, share of cost in %, average price) with your holdings. Unused rows can be set to a share of 0. Row 1 is used for the BTC benchmark. Shares do not need to add up to 100: the script normalises them.
Notes and limitations
- The line before today assumes today's holdings, so it shows how the current basket would have looked at earlier prices, not the historical account value.
- Realised profits or losses from past sales are not included.
- Prices are spot closes on Binance; works on any timeframe, daily is the natural one.
- Coins that did not exist yet are left out of the average on those bars.
Educational tool. Not investment advice. Own capital; this is not an offer or portfolio management for third parties.
---
ES
Seguimiento de cartera: rendimiento sobre el precio medio frente a BTC. El script sigue en vivo una cartera spot de varias monedas: cuánto valen hoy las posiciones frente a lo que costaron, y cómo se compara con haber puesto el mismo dinero solo en BTC. Los valores por defecto son la cartera 40/60 de BICAPITAL al 5 de noviembre de 2026 (40 % BTC y 60 % repartido entre 21 alts, con la parte del coste y el precio medio reales de cada moneda). Al publicar, la cartera iba −5,9 % sobre el coste y BTC con los mismos flujos −4,3 %. Se puede usar con cualquier cartera cambiando las 22 filas. Herramienta educativa; no es asesoría de inversión.

면책사항
해당 정보와 게시물은 금융, 투자, 트레이딩 또는 기타 유형의 조언이나 권장 사항으로 간주되지 않으며, 트레이딩뷰에서 제공하거나 보증하는 것이 아닙니다. 자세한 내용은 이용 약관을 참조하세요.
면책사항
해당 정보와 게시물은 금융, 투자, 트레이딩 또는 기타 유형의 조언이나 권장 사항으로 간주되지 않으며, 트레이딩뷰에서 제공하거나 보증하는 것이 아닙니다. 자세한 내용은 이용 약관을 참조하세요.