OPEN-SOURCE SCRIPT
HTF Candle Range
Overview
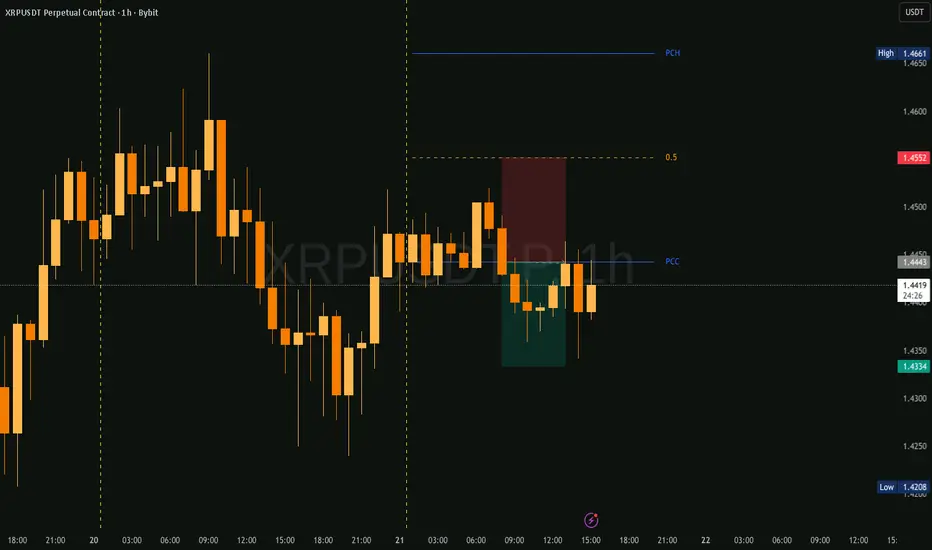
This indicator is designed for price action traders who focus on Higher Timeframe (HTF) market structures. It automatically identifies the key range of the previous closed HTF candle (e.g., Daily, 4H) and projects it onto your current lower timeframe chart. By focusing on the relationship between the High, Low, and Close of the previous period, it highlights high-probability zones for the current session.
Core Features
How to Trade with this Indicator
This tool is particularly effective for two main setups:
Alerts & Notifications
Never miss a move with built-in alert support. You can set up notifications for:
Note: Use the "Any" or specific "Breakout" conditions in the TradingView Alert menu for real-time push notifications or email alerts.
Settings
This indicator is designed for price action traders who focus on Higher Timeframe (HTF) market structures. It automatically identifies the key range of the previous closed HTF candle (e.g., Daily, 4H) and projects it onto your current lower timeframe chart. By focusing on the relationship between the High, Low, and Close of the previous period, it highlights high-probability zones for the current session.
Core Features
- Dynamic Range Detection: Automatically identifies and marks the Previous Candle Close (PCC) and the Previous Candle High (PCH) or Low (PCL), depending on whether the candle was bullish or bearish.
- Customizable Fibonacci Zones: Includes two fully adjustable Fibonacci levels (defaulting to 0.5 and 0.618) to identify "Golden Pocket" retracement areas within the HTF range.
- Clean Visuals: Lines start precisely at the HTF session open and extend a customizable distance past the current price, keeping your chart uncluttered.
- Fully Styled: Toggle visibility, change colors, line weights, and styles (solid, dashed, or dotted) directly from the input menu.
How to Trade with this Indicator
This tool is particularly effective for two main setups:
- Breakout Entries: Watch for strong momentum candles closing outside the blue boundary lines (PCC/PCH or PCC/PCL). A break above the PCH often signals continued bullish flow, while a break below the PCL suggests further downside.
- Pullback (Retracement) Entries: After a move has started, look for the price to "breathe back" into the orange Fibonacci levels. The 0.5 and 0.618 levels act as prime areas for entries in the direction of the HTF trend, offering a superior risk-to-reward ratio.
Alerts & Notifications
Never miss a move with built-in alert support. You can set up notifications for:
- Top Level Breakout: Triggers when the price crosses above the upper boundary.
- Bottom Level Breakout: Triggers when the price crosses below the lower boundary.
- Any Level Breakout: A single alert to monitor both boundaries simultaneously.
Note: Use the "Any" or specific "Breakout" conditions in the TradingView Alert menu for real-time push notifications or email alerts.
Settings
- Higher Timeframe: Set this to your anchor timeframe (e.g., Daily for intraday trading).
- Label Offset: Controls how far the lines and labels extend into the future.
- Fibonacci Levels: Use the inline inputs to toggle levels on/off, adjust the ratio, and customize the appearance.
오픈 소스 스크립트
트레이딩뷰의 진정한 정신에 따라, 이 스크립트의 작성자는 이를 오픈소스로 공개하여 트레이더들이 기능을 검토하고 검증할 수 있도록 했습니다. 작성자에게 찬사를 보냅니다! 이 코드는 무료로 사용할 수 있지만, 코드를 재게시하는 경우 하우스 룰이 적용된다는 점을 기억하세요.

면책사항
해당 정보와 게시물은 금융, 투자, 트레이딩 또는 기타 유형의 조언이나 권장 사항으로 간주되지 않으며, 트레이딩뷰에서 제공하거나 보증하는 것이 아닙니다. 자세한 내용은 이용 약관을 참조하세요.
오픈 소스 스크립트
트레이딩뷰의 진정한 정신에 따라, 이 스크립트의 작성자는 이를 오픈소스로 공개하여 트레이더들이 기능을 검토하고 검증할 수 있도록 했습니다. 작성자에게 찬사를 보냅니다! 이 코드는 무료로 사용할 수 있지만, 코드를 재게시하는 경우 하우스 룰이 적용된다는 점을 기억하세요.
면책사항
해당 정보와 게시물은 금융, 투자, 트레이딩 또는 기타 유형의 조언이나 권장 사항으로 간주되지 않으며, 트레이딩뷰에서 제공하거나 보증하는 것이 아닙니다. 자세한 내용은 이용 약관을 참조하세요.