Confirmed Close Flow
WHAT THIS IS
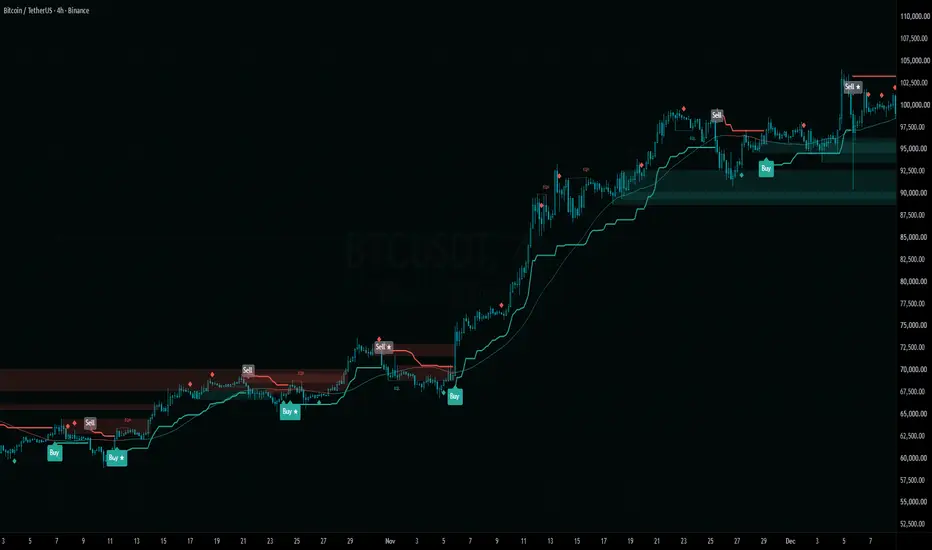
Confirmed Close Flow is a swing trading companion for the 4 hour chart. It puts a trend, a momentum read and market structure on one chart, and it only counts a signal once the candle has closed.
The main signal is simple. A Buy or Sell label appears when the 4H trend flips, and it is drawn in full colour only when the daily trend agrees. A flip against the daily trend is still shown, but small and grey, so you can see it without being tempted by it.
Around that core you get momentum diamonds, confluence stars, break of structure and change of character labels, order blocks, fair value gaps, equal highs and lows, previous day, week and month levels, and a small dashboard that tells you where things stand right now.
It was built for crypto on the 4H with a 1D filter. It runs on any market and timeframe, but that pairing is the one it was designed and tuned around.
WHY CONFIRMED CLOSE
A lot of chart tools look brilliant on history and behave differently live. The reason is usually the same: a signal is allowed to appear while the candle is still forming, and it can vanish again before the close. The history only keeps the versions that survived.
This script decides every signal on a closed bar. A label that prints stays printed. An alert set to "Once Per Bar Close" fires once, at the close, and the chart will still show the same thing after a reload.
The higher timeframe filter follows the same rule. It reads the daily trend from the last CLOSED daily candle, never from today's candle that is still moving. The previous day, week and month levels work the same way.
Two honest notes on timing:
- Market structure needs pivots, and a pivot can only be confirmed a few bars after it happens. The structure line is drawn back to the pivot, but the break itself is only known on the bar where the label appears.
- Execution is up to you. A signal on the close of one candle means the earliest realistic entry is the open of the next one.
HOW TO READ THE CHART
Trend line
A green line under price means the 4H trend is up. A red line above price means it is down. It is an ATR based trailing line, so it gives price room to breathe and only flips when a move is strong enough to matter.
Buy and Sell labels
- Full colour Buy: the 4H trend just flipped up and the daily trend is up.
- Full colour Sell: the 4H trend just flipped down and the daily trend is down.
- Small grey Buy or Sell: the 4H flipped against the daily trend. Worth knowing, not worth acting on by itself.
- Grey full size label: the flip happened while the market was choppy (see Choppiness below).
Background tint
A faint green or red wash shows the daily trend at a glance. When the tint and the trend line agree, the 4H and the daily are aligned.
Momentum diamonds
A small diamond under a candle marks a momentum turn up from a stretched low. A diamond above marks a turn down from a stretched high. They are early warnings, not trade signals on their own. The thin line through price is the momentum moving average, coloured by which side of it momentum sits.
Confluence stars
A star means a trend flip and a momentum diamond happened in the same direction within a few bars of each other. When a star lands on the same bar as a Buy or Sell, it is folded into the label ("Buy ★", "Sell ★"). Only one star is drawn per trend leg.
Structure
BOS (break of structure) marks a close through the last pivot in the direction of the current structure. CHoCH (change of character) marks a close through it in the other direction, the first sign that structure is turning. Internal structure (dashed) follows the short swings. Swing structure (solid, off by default) follows the big ones.
Order blocks
When structure breaks with a strong candle, the script marks the last opposite candle before the move as a zone. Green zones sit below price as possible support, red zones above as possible resistance. A zone stays live until a candle closes through its far side. After that it is cut off at the bar that broke it and faded, so you can still see where it was.
Fair value gaps (off by default)
A three candle imbalance where the first and third candles do not overlap. The box is removed once price fills it.
Equal highs and lows
Dotted lines marked EQH or EQL where two pivots formed at nearly the same price. These levels often attract price, because stops tend to sit just beyond them.
Dashboard
Bottom right by default. It shows the current 4H trend, the daily filter, whether they are aligned, the momentum value, internal and swing structure direction, and the Choppiness Index. It always describes the last closed bar.
HOW TO USE IT
A simple way to work with it:
1. Use the 4H chart with the daily filter (the default).
2. Take the full colour Buy and Sell labels as your primary signals. They are the trend flips that agree with the bigger picture.
3. Treat grey labels as information. A grey Sell inside a daily uptrend is often just a pullback.
4. Use structure and order blocks to plan the trade: where the idea is wrong (below the last higher low or the nearest bullish block for a long) and where price may react (the next bearish block or equal highs above).
5. Be careful when the Choppiness value is high. Trend signals in a sideways market cost money.
6. Set alerts with "Once Per Bar Close".
Alerts
After adding the script, open Create Alert and choose Confirmed Close Flow as the condition. The conditions are:
- Buy (with filter), Sell (with filter): the main signals.
- Any trend flip up, Any trend flip down: every flip, aligned or not.
- Momentum buy, Momentum sell: the diamonds.
- Confluence buy, Confluence sell: the stars.
- Internal BOS, Swing BOS, Internal CHoCH, Swing CHoCH.
- Equal highs, Equal lows.
- Bullish FVG, Bearish FVG.
- Internal OB broken, Swing OB broken: a candle closed through a zone. A touch does not count.
TradingView stores the script settings when an alert is created. If you change a setting later, delete the alert and create it again.
SETTINGS
Trend
- ATR period (10) and Multiplier (3.0): the trailing trend line. A higher multiplier gives fewer, slower flips. A lower one reacts faster and gets shaken out more often.
- Higher timeframe filter (1D): the timeframe whose trend decides whether a flip is aligned. It is read from the last closed candle of that timeframe. Pick something 3 to 6 times your chart timeframe.
- Flips against the filter (Grey): Grey shows them small and grey, Hide removes them, Show draws them like aligned flips.
- Grey out flips in chop (on): a flip that happens while the Choppiness Index is above the limit is drawn grey.
- Choppiness length (14) and Choppiness limit (61.8): the Choppiness Index settings. Above the limit the market is treated as sideways.
- Tint background by filter trend (on).
Momentum
- MA type (SMA) and MA length (40): the average that momentum is measured against.
- Oscillator smoothing (15): smoothing of the momentum line.
- Threshold (0.5): how stretched momentum must be, in ATR units, before a diamond can print. Higher means fewer, more extreme diamonds.
- Show diamonds (on), Show MA line (on), Colour candles by momentum (off).
Confluence
- Show confluence stars (on).
- Window (3 bars): how close together a flip and a diamond must be to earn a star. 0 means the same bar only.
Structure
- Internal pivot length (5) and Swing pivot length (50): how many bars on each side a pivot needs. Larger values mean fewer, more significant pivots, and a longer wait before a pivot is confirmed.
- Show internal structure (on), Show swing structure (off).
- Structure labels (All): show all breaks, only BOS or only CHoCH.
- Structure mode (Present): Present keeps only the latest bullish and bearish break per scale for a clean chart. Historical keeps them all. This only changes the drawings. Alerts fire either way.
Order blocks
- Internal order blocks (on), Swing order blocks (off).
- Max blocks per side (5): how many live zones to keep.
- Mitigation (Close): Close means a candle must close through the far side of the zone to break it. High/Low means a wick is enough.
- Keep broken blocks (faded) (on): broken zones stay on the chart, faded, instead of disappearing.
- Require displacement (on) and Displacement (1.0 ATR): only mark a zone when the candle that broke structure is at least this big. This drops the weak zones left behind by slow drifts through a level.
Fair value gaps
- Show fair value gaps (off).
- Minimum gap (0.25 ATR): smaller gaps are ignored.
- Remove when (Full fill): Full fill waits for the whole gap to be traded through, Half fill removes it at the midpoint.
- Max gaps per side (10).
Equal highs and lows
- Show equal highs/lows (on).
- Pivot length (3).
- Tolerance (0.1 ATR): how close two pivots must be to count as equal.
Higher timeframe levels
- Previous day, week and month high and low (all off). Each uses the last closed period only.
Dashboard
- Show dashboard (on), Position (Bottom right), Text size (Small).
Colours
- Up, Down and Grey colours for every element.
ABOUT THE SETTINGS
The defaults are the ones the script was built and checked with on the 4H chart with a daily filter. They were not optimised bar by bar for any single market. If you change them, change one at a time and look at a long stretch of history, not the last few weeks.
Lower timeframes are a different game. On 1H and below the same logic produced many more flips, and fees and noise eat a much bigger share of each move. Use it there as a map of trend and structure rather than as a signal generator.
CREDIT
The trend line is the Supertrend method (Olivier Seban). The chop filter is the Choppiness Index (E.W. Dreiss). Break of structure, change of character, order blocks, fair value gaps and equal highs and lows are widely used price action concepts. The code, the higher timeframe alignment, the confirmed close handling and the way the parts are combined are original to this script.
LIMITATIONS
- No indicator knows the future. A full colour Buy is a trend flip that agrees with the daily trend, nothing more.
- Trend following loses in sideways markets. Expect a run of small losses before a trend pays for them.
- Structure labels depend on pivots that are confirmed a few bars late, as explained above.
- Order blocks, fair value gaps and equal highs and lows are areas of interest, not guaranteed turning points.
- A gap between one candle's close and the next candle's open can move price past any level before you can act.
- This is a charting tool for education and analysis. It is not financial advice and it does not place trades.
Confirmed Close Flow is a swing trading companion for the 4 hour chart. It puts a trend, a momentum read and market structure on one chart, and it only counts a signal once the candle has closed.
The main signal is simple. A Buy or Sell label appears when the 4H trend flips, and it is drawn in full colour only when the daily trend agrees. A flip against the daily trend is still shown, but small and grey, so you can see it without being tempted by it.
Around that core you get momentum diamonds, confluence stars, break of structure and change of character labels, order blocks, fair value gaps, equal highs and lows, previous day, week and month levels, and a small dashboard that tells you where things stand right now.
It was built for crypto on the 4H with a 1D filter. It runs on any market and timeframe, but that pairing is the one it was designed and tuned around.
WHY CONFIRMED CLOSE
A lot of chart tools look brilliant on history and behave differently live. The reason is usually the same: a signal is allowed to appear while the candle is still forming, and it can vanish again before the close. The history only keeps the versions that survived.
This script decides every signal on a closed bar. A label that prints stays printed. An alert set to "Once Per Bar Close" fires once, at the close, and the chart will still show the same thing after a reload.
The higher timeframe filter follows the same rule. It reads the daily trend from the last CLOSED daily candle, never from today's candle that is still moving. The previous day, week and month levels work the same way.
Two honest notes on timing:
- Market structure needs pivots, and a pivot can only be confirmed a few bars after it happens. The structure line is drawn back to the pivot, but the break itself is only known on the bar where the label appears.
- Execution is up to you. A signal on the close of one candle means the earliest realistic entry is the open of the next one.
HOW TO READ THE CHART
Trend line
A green line under price means the 4H trend is up. A red line above price means it is down. It is an ATR based trailing line, so it gives price room to breathe and only flips when a move is strong enough to matter.
Buy and Sell labels
- Full colour Buy: the 4H trend just flipped up and the daily trend is up.
- Full colour Sell: the 4H trend just flipped down and the daily trend is down.
- Small grey Buy or Sell: the 4H flipped against the daily trend. Worth knowing, not worth acting on by itself.
- Grey full size label: the flip happened while the market was choppy (see Choppiness below).
Background tint
A faint green or red wash shows the daily trend at a glance. When the tint and the trend line agree, the 4H and the daily are aligned.
Momentum diamonds
A small diamond under a candle marks a momentum turn up from a stretched low. A diamond above marks a turn down from a stretched high. They are early warnings, not trade signals on their own. The thin line through price is the momentum moving average, coloured by which side of it momentum sits.
Confluence stars
A star means a trend flip and a momentum diamond happened in the same direction within a few bars of each other. When a star lands on the same bar as a Buy or Sell, it is folded into the label ("Buy ★", "Sell ★"). Only one star is drawn per trend leg.
Structure
BOS (break of structure) marks a close through the last pivot in the direction of the current structure. CHoCH (change of character) marks a close through it in the other direction, the first sign that structure is turning. Internal structure (dashed) follows the short swings. Swing structure (solid, off by default) follows the big ones.
Order blocks
When structure breaks with a strong candle, the script marks the last opposite candle before the move as a zone. Green zones sit below price as possible support, red zones above as possible resistance. A zone stays live until a candle closes through its far side. After that it is cut off at the bar that broke it and faded, so you can still see where it was.
Fair value gaps (off by default)
A three candle imbalance where the first and third candles do not overlap. The box is removed once price fills it.
Equal highs and lows
Dotted lines marked EQH or EQL where two pivots formed at nearly the same price. These levels often attract price, because stops tend to sit just beyond them.
Dashboard
Bottom right by default. It shows the current 4H trend, the daily filter, whether they are aligned, the momentum value, internal and swing structure direction, and the Choppiness Index. It always describes the last closed bar.
HOW TO USE IT
A simple way to work with it:
1. Use the 4H chart with the daily filter (the default).
2. Take the full colour Buy and Sell labels as your primary signals. They are the trend flips that agree with the bigger picture.
3. Treat grey labels as information. A grey Sell inside a daily uptrend is often just a pullback.
4. Use structure and order blocks to plan the trade: where the idea is wrong (below the last higher low or the nearest bullish block for a long) and where price may react (the next bearish block or equal highs above).
5. Be careful when the Choppiness value is high. Trend signals in a sideways market cost money.
6. Set alerts with "Once Per Bar Close".
Alerts
After adding the script, open Create Alert and choose Confirmed Close Flow as the condition. The conditions are:
- Buy (with filter), Sell (with filter): the main signals.
- Any trend flip up, Any trend flip down: every flip, aligned or not.
- Momentum buy, Momentum sell: the diamonds.
- Confluence buy, Confluence sell: the stars.
- Internal BOS, Swing BOS, Internal CHoCH, Swing CHoCH.
- Equal highs, Equal lows.
- Bullish FVG, Bearish FVG.
- Internal OB broken, Swing OB broken: a candle closed through a zone. A touch does not count.
TradingView stores the script settings when an alert is created. If you change a setting later, delete the alert and create it again.
SETTINGS
Trend
- ATR period (10) and Multiplier (3.0): the trailing trend line. A higher multiplier gives fewer, slower flips. A lower one reacts faster and gets shaken out more often.
- Higher timeframe filter (1D): the timeframe whose trend decides whether a flip is aligned. It is read from the last closed candle of that timeframe. Pick something 3 to 6 times your chart timeframe.
- Flips against the filter (Grey): Grey shows them small and grey, Hide removes them, Show draws them like aligned flips.
- Grey out flips in chop (on): a flip that happens while the Choppiness Index is above the limit is drawn grey.
- Choppiness length (14) and Choppiness limit (61.8): the Choppiness Index settings. Above the limit the market is treated as sideways.
- Tint background by filter trend (on).
Momentum
- MA type (SMA) and MA length (40): the average that momentum is measured against.
- Oscillator smoothing (15): smoothing of the momentum line.
- Threshold (0.5): how stretched momentum must be, in ATR units, before a diamond can print. Higher means fewer, more extreme diamonds.
- Show diamonds (on), Show MA line (on), Colour candles by momentum (off).
Confluence
- Show confluence stars (on).
- Window (3 bars): how close together a flip and a diamond must be to earn a star. 0 means the same bar only.
Structure
- Internal pivot length (5) and Swing pivot length (50): how many bars on each side a pivot needs. Larger values mean fewer, more significant pivots, and a longer wait before a pivot is confirmed.
- Show internal structure (on), Show swing structure (off).
- Structure labels (All): show all breaks, only BOS or only CHoCH.
- Structure mode (Present): Present keeps only the latest bullish and bearish break per scale for a clean chart. Historical keeps them all. This only changes the drawings. Alerts fire either way.
Order blocks
- Internal order blocks (on), Swing order blocks (off).
- Max blocks per side (5): how many live zones to keep.
- Mitigation (Close): Close means a candle must close through the far side of the zone to break it. High/Low means a wick is enough.
- Keep broken blocks (faded) (on): broken zones stay on the chart, faded, instead of disappearing.
- Require displacement (on) and Displacement (1.0 ATR): only mark a zone when the candle that broke structure is at least this big. This drops the weak zones left behind by slow drifts through a level.
Fair value gaps
- Show fair value gaps (off).
- Minimum gap (0.25 ATR): smaller gaps are ignored.
- Remove when (Full fill): Full fill waits for the whole gap to be traded through, Half fill removes it at the midpoint.
- Max gaps per side (10).
Equal highs and lows
- Show equal highs/lows (on).
- Pivot length (3).
- Tolerance (0.1 ATR): how close two pivots must be to count as equal.
Higher timeframe levels
- Previous day, week and month high and low (all off). Each uses the last closed period only.
Dashboard
- Show dashboard (on), Position (Bottom right), Text size (Small).
Colours
- Up, Down and Grey colours for every element.
ABOUT THE SETTINGS
The defaults are the ones the script was built and checked with on the 4H chart with a daily filter. They were not optimised bar by bar for any single market. If you change them, change one at a time and look at a long stretch of history, not the last few weeks.
Lower timeframes are a different game. On 1H and below the same logic produced many more flips, and fees and noise eat a much bigger share of each move. Use it there as a map of trend and structure rather than as a signal generator.
CREDIT
The trend line is the Supertrend method (Olivier Seban). The chop filter is the Choppiness Index (E.W. Dreiss). Break of structure, change of character, order blocks, fair value gaps and equal highs and lows are widely used price action concepts. The code, the higher timeframe alignment, the confirmed close handling and the way the parts are combined are original to this script.
LIMITATIONS
- No indicator knows the future. A full colour Buy is a trend flip that agrees with the daily trend, nothing more.
- Trend following loses in sideways markets. Expect a run of small losses before a trend pays for them.
- Structure labels depend on pivots that are confirmed a few bars late, as explained above.
- Order blocks, fair value gaps and equal highs and lows are areas of interest, not guaranteed turning points.
- A gap between one candle's close and the next candle's open can move price past any level before you can act.
- This is a charting tool for education and analysis. It is not financial advice and it does not place trades.

The Rotation Ladder: a five step trend system that decides what to hold, crypto, the leading major, gold, equities or cash. Method, backtest and the live signal, free and in the open. confirmedclose.com
면책사항
해당 정보와 게시물은 금융, 투자, 트레이딩 또는 기타 유형의 조언이나 권장 사항으로 간주되지 않으며, 트레이딩뷰에서 제공하거나 보증하는 것이 아닙니다. 자세한 내용은 이용 약관을 참조하세요.
The Rotation Ladder: a five step trend system that decides what to hold, crypto, the leading major, gold, equities or cash. Method, backtest and the live signal, free and in the open. confirmedclose.com
면책사항
해당 정보와 게시물은 금융, 투자, 트레이딩 또는 기타 유형의 조언이나 권장 사항으로 간주되지 않으며, 트레이딩뷰에서 제공하거나 보증하는 것이 아닙니다. 자세한 내용은 이용 약관을 참조하세요.