OPEN-SOURCE SCRIPT
nifty vwap 3
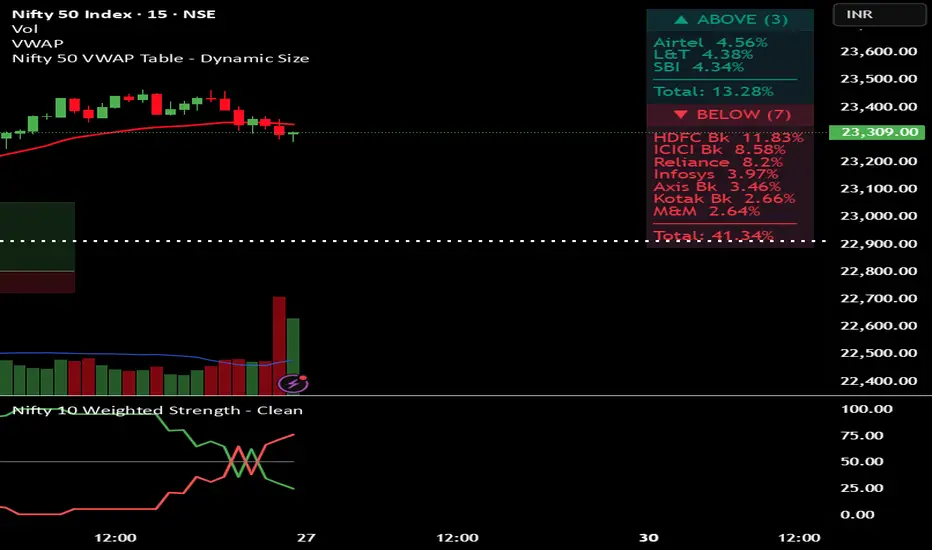
Monitors the "Big Players"
It tracks the 10 most important stocks (like HDFC Bank, Reliance, and ICICI Bank) because these stocks carry the most "weight" and usually decide where the Nifty index goes.
2. The VWAP Test (The Filter)
For each stock, the code checks:
Is the current price Above its average price (VWAP)?
Or is it Below its average price?
Why? If a stock is above VWAP, it is considered Strong (buyers are in control). If it is below, it is Weak (sellers are in control).
3. Calculates "Power" (Weightage)
Instead of just counting stocks, it calculates their combined percentage in the Nifty.
Example: If only 3 stocks are "Above VWAP" but they are the biggest ones (like HDFC and Reliance), the "Total Weight" might still be very high (e.g., 30%), suggesting the market has underlying strength despite fewer stocks being green.
4. Visual Table
It puts all this info into a neat Table on the top-right of your chart.
Teal Section: Shows stocks that are Strong/Bullish.
Red Section: Shows stocks that are Weak/Bearish.
Summary: It tells you exactly how many stocks are on each side and their total percentage impact.
It tracks the 10 most important stocks (like HDFC Bank, Reliance, and ICICI Bank) because these stocks carry the most "weight" and usually decide where the Nifty index goes.
2. The VWAP Test (The Filter)
For each stock, the code checks:
Is the current price Above its average price (VWAP)?
Or is it Below its average price?
Why? If a stock is above VWAP, it is considered Strong (buyers are in control). If it is below, it is Weak (sellers are in control).
3. Calculates "Power" (Weightage)
Instead of just counting stocks, it calculates their combined percentage in the Nifty.
Example: If only 3 stocks are "Above VWAP" but they are the biggest ones (like HDFC and Reliance), the "Total Weight" might still be very high (e.g., 30%), suggesting the market has underlying strength despite fewer stocks being green.
4. Visual Table
It puts all this info into a neat Table on the top-right of your chart.
Teal Section: Shows stocks that are Strong/Bullish.
Red Section: Shows stocks that are Weak/Bearish.
Summary: It tells you exactly how many stocks are on each side and their total percentage impact.
오픈 소스 스크립트
트레이딩뷰의 진정한 정신에 따라, 이 스크립트의 작성자는 이를 오픈소스로 공개하여 트레이더들이 기능을 검토하고 검증할 수 있도록 했습니다. 작성자에게 찬사를 보냅니다! 이 코드는 무료로 사용할 수 있지만, 코드를 재게시하는 경우 하우스 룰이 적용된다는 점을 기억하세요.

면책사항
해당 정보와 게시물은 금융, 투자, 트레이딩 또는 기타 유형의 조언이나 권장 사항으로 간주되지 않으며, 트레이딩뷰에서 제공하거나 보증하는 것이 아닙니다. 자세한 내용은 이용 약관을 참조하세요.
오픈 소스 스크립트
트레이딩뷰의 진정한 정신에 따라, 이 스크립트의 작성자는 이를 오픈소스로 공개하여 트레이더들이 기능을 검토하고 검증할 수 있도록 했습니다. 작성자에게 찬사를 보냅니다! 이 코드는 무료로 사용할 수 있지만, 코드를 재게시하는 경우 하우스 룰이 적용된다는 점을 기억하세요.
면책사항
해당 정보와 게시물은 금융, 투자, 트레이딩 또는 기타 유형의 조언이나 권장 사항으로 간주되지 않으며, 트레이딩뷰에서 제공하거나 보증하는 것이 아닙니다. 자세한 내용은 이용 약관을 참조하세요.