Liquidity Stress Exhaustion [MarkitTick]
More exclusive indicators from MarkitTick
Subscribe to MarkitTick for $43.75/month to get exclusive indicators by this author. You pay right on TradingView and can use them on your charts straight away.
Explore MarkitTick💡 A market-microstructure stress detector that flags moments of seller or buyer exhaustion by combining an Amihud-style illiquidity z-score with trend regime, a regression-based fair-value channel, and automated ATR trade levels. Rather than reacting to price alone, this script measures how much price is moving relative to the volume behind it, then cross-references that stress reading against trend direction and candle behavior to identify points where aggressive selling or buying is likely running out of steam.
✨ Originality and Utility
Most exhaustion-based tools on TradingView rely on oscillator extremes (RSI, Stochastic) or candlestick pattern recognition in isolation. This script takes a different route: it borrows a concept from academic market-microstructure literature — price impact per unit of volume, i.e., illiquidity — and turns it into a real-time, standardized stress signal. Instead of asking "is price overextended?", it asks "is price moving too much for the volume that's actually trading?" A large true-range on abnormally low volume is treated as a sign of thin, stressed liquidity, and it is this stress, combined with a counter-trend candle, that defines exhaustion here — not price level alone.
This is not a simple mashup of unrelated indicators bolted together for the sake of a new publication. The illiquidity stress engine, the trend filter, the regression channel, and the correlation/ADX filters are all working toward a single, coherent question: is the current directional move statistically and structurally likely to reverse or stall? The z-scored stress reading identifies unusual conditions, the EMA trend filter and candle-close direction confirm which side is under pressure, and the optional Pearson-R and ADX filters exist specifically to suppress signals when the broader price action lacks the statistical structure (trending correlation, directional strength) needed to make the exhaustion reading meaningful. Each component narrows the false-positive rate of the others; removing any one of them would meaningfully change what the tool measures.
The script goes further than a plain signal generator by translating each exhaustion event into a fully computed trade plan — an ATR-derived stop, a dynamically computed R (risk unit), and three R-multiple take-profit targets — visualized directly on the chart and exposed through a structured alert payload designed for automation.
🔬 Methodology and Concepts

• Illiquidity Stress Engine
The core of the script computes a proxy for market illiquidity on every bar: true range divided by volume (with a safe fallback when volume is zero or unavailable), then compressed with a natural-log transform to tame outliers. This raw illiquidity series is then standardized into a z-score using a rolling mean and standard deviation over the "Stats Lookback" period. A z-score above your chosen "Stress Threshold (σ)" marks the bar as being in a state of high stress — meaning price moved an unusually large amount for the volume that supported it, a hallmark of thin liquidity and potential exhaustion of the prevailing move.
• Trend Regime Filter
Direction is established by comparing price (optionally pre-smoothed by an adaptive filter, see below) against an EMA of configurable length. Price below the EMA defines a downtrend; price above defines an uptrend. Exhaustion signals are only valid when they occur against the backdrop of an established trend in the opposite direction — a seller exhaustion signal requires the prior bar to have closed in a downtrend on a red candle, while buyer exhaustion requires an uptrend and a green candle.
• Adaptive Price Filters (Optional)
Two optional smoothing methods can replace raw closing price throughout the trend calculation:
These exist to give the trend filter a smoother, less noise-reactive input than raw closing price when desired.
• Regression Fair-Value Channel
On the most recent bar, the script performs a least-squares linear regression over a lookback window (either a fixed length, or a dynamic length measured from the most recent qualifying pivot, capped by "Max Lookback Cap") using hlc3 as the source. From this it derives the regression line itself, its standard deviation, and the Pearson correlation coefficient (R), which measures how well price actually fits a straight line over that window. Inner and outer channel bands are plotted at user-defined standard-deviation multiples above and below the regression line, giving a visual statistical envelope for the recent price trend.
• Correlation and ADX Filters
Two independent filters can suppress exhaustion signals when the broader trend lacks structural conviction:
• Pivot Detection
Standard confirmed pivot highs and lows (requiring the specified number of bars on each side) are tracked internally to support the optional Dynamic Pivot Mode, which — when enabled — sizes the regression lookback to the distance since the most recent confirmed pivot rather than using a fixed length.
• ATR Trade Level Construction
When a qualifying exhaustion signal fires and is confirmed, the script computes a full trade plan: the entry is the closing price of the confirmed exhaustion bar, the stop-loss is placed one ATR-multiple away (your "ATR SL Multiplier" times ATR over "ATR Length"), and the resulting stop distance defines one Risk unit ("R"). Three take-profit levels are then placed at your chosen R-multiples (default 1R, 2R, 3R) from entry. This entire trade plan updates and redraws only when a new, unlocked exhaustion signal fires.
• Lock Signal
Enabling "Lock Signal" freezes the currently displayed trade plan on the chart, preventing new exhaustion events from overwriting the active levels — useful for manually tracking a single trade through to its conclusion without the visual being replaced mid-trade.
🎨 Visual Guide

● Exhaustion Labels
● Regression Channel
● Trade Level Lines
Plotted only after a qualifying exhaustion event, extending toward the current bar:
● Dashboard (Table)
A compact panel, positioned per your "Dashboard Position" setting, reporting in real time: Lock status, current Trend Regime (Bullish/Bearish), Seller Status and Buyer Status (Exhausted/Normal), a visual Channel Width bar-meter (color-graded green/amber/red by relative width), a visual Pearson R bar-meter (same color grading by correlation strength), and — when an exhaustion signal is currently active — the live Entry, Stop Loss, and TP1 price levels. ADX value and Adaptive Filter type are appended as additional rows only when those features are enabled in the inputs.
📖 How to Use

⚙️ Inputs and Settings

● Core Settings
● Filters
● Trade Tools
● Visuals
● Dashboard
● Alerts
● Colors
🔍 Deconstruction of the Underlying Scientific and Academic Framework
● Illiquidity as a Price-Impact Proxy
The stress engine's core calculation — true range divided by volume — is a simplified, bar-by-bar adaptation of the price-impact style illiquidity measures used in market microstructure research, most notably the Amihud illiquidity ratio, which relates absolute returns to trading volume as a proxy for how much a given amount of volume "costs" in terms of price movement. The underlying academic intuition is that in illiquid or stressed conditions, smaller volumes produce disproportionately larger price swings; the log transform compresses the resulting distribution to reduce the influence of extreme outlier bars before standardization.
● Z-Score Standardization and Statistical Anomaly Detection
Converting the raw illiquidity reading into a z-score against its own rolling mean and standard deviation is a direct application of statistical process control / anomaly-detection theory: rather than using a fixed, market-agnostic threshold, the script defines "abnormal" relative to each instrument's and timeframe's own recent behavior. This adaptive standardization is a common approach in quantitative finance for regime and outlier detection, since raw price-impact values are not comparable across instruments, timeframes, or volatility regimes without normalization.
● Ordinary Least Squares Regression and Goodness-of-Fit
The fair-value channel is constructed using closed-form ordinary least-squares (OLS) regression formulas computed directly from the summary statistics of the price series (sums of x, y, x², xy, y²) rather than an iterative solver — a standard, numerically efficient approach for simple linear regression. The accompanying Pearson correlation coefficient is the classical goodness-of-fit statistic for this regression: it quantifies how well a straight line explains the price action over the lookback window, providing a principled, quantitative basis (rather than visual judgment) for deciding whether "trend" is a statistically meaningful description of recent price behavior.
● Recursive State Estimation (Kalman Filtering)
The optional Kalman Filter smoothing option is a simplified, single-dimension implementation of the classical Kalman filter from control theory and signal processing — a recursive Bayesian estimator that maintains a running estimate of a system's true state (here, price) and continuously updates it by weighting new observations against the model's own uncertainty. This provides a theoretically grounded alternative to fixed-window moving averages for noise reduction.
● Trend-Following Directional Strength (ADX/DMI)
The optional ADX filter draws on Welles Wilder's Directional Movement System, a long-established technical framework for separating trend strength from trend direction. Using it as a gate rather than a signal generator reflects its intended academic role: ADX does not indicate direction, only the strength of whatever directional move is present, making it a natural confluence filter for suppressing signals during structurally weak, low-conviction price action.
⚠️ Disclaimer
All provided scripts and indicators are strictly for educational exploration and must not be interpreted as financial advice or a recommendation to execute trades. We expressly disclaim all liability for any financial losses or damages that may result, directly or indirectly, from the reliance on or application of these tools. Market participation carries inherent risk where past performance never guarantees future returns, leaving all investment decisions and due diligence solely at your own discretion.
✨ Originality and Utility
Most exhaustion-based tools on TradingView rely on oscillator extremes (RSI, Stochastic) or candlestick pattern recognition in isolation. This script takes a different route: it borrows a concept from academic market-microstructure literature — price impact per unit of volume, i.e., illiquidity — and turns it into a real-time, standardized stress signal. Instead of asking "is price overextended?", it asks "is price moving too much for the volume that's actually trading?" A large true-range on abnormally low volume is treated as a sign of thin, stressed liquidity, and it is this stress, combined with a counter-trend candle, that defines exhaustion here — not price level alone.
This is not a simple mashup of unrelated indicators bolted together for the sake of a new publication. The illiquidity stress engine, the trend filter, the regression channel, and the correlation/ADX filters are all working toward a single, coherent question: is the current directional move statistically and structurally likely to reverse or stall? The z-scored stress reading identifies unusual conditions, the EMA trend filter and candle-close direction confirm which side is under pressure, and the optional Pearson-R and ADX filters exist specifically to suppress signals when the broader price action lacks the statistical structure (trending correlation, directional strength) needed to make the exhaustion reading meaningful. Each component narrows the false-positive rate of the others; removing any one of them would meaningfully change what the tool measures.
The script goes further than a plain signal generator by translating each exhaustion event into a fully computed trade plan — an ATR-derived stop, a dynamically computed R (risk unit), and three R-multiple take-profit targets — visualized directly on the chart and exposed through a structured alert payload designed for automation.
🔬 Methodology and Concepts
• Illiquidity Stress Engine
The core of the script computes a proxy for market illiquidity on every bar: true range divided by volume (with a safe fallback when volume is zero or unavailable), then compressed with a natural-log transform to tame outliers. This raw illiquidity series is then standardized into a z-score using a rolling mean and standard deviation over the "Stats Lookback" period. A z-score above your chosen "Stress Threshold (σ)" marks the bar as being in a state of high stress — meaning price moved an unusually large amount for the volume that supported it, a hallmark of thin liquidity and potential exhaustion of the prevailing move.
• Trend Regime Filter
Direction is established by comparing price (optionally pre-smoothed by an adaptive filter, see below) against an EMA of configurable length. Price below the EMA defines a downtrend; price above defines an uptrend. Exhaustion signals are only valid when they occur against the backdrop of an established trend in the opposite direction — a seller exhaustion signal requires the prior bar to have closed in a downtrend on a red candle, while buyer exhaustion requires an uptrend and a green candle.
• Adaptive Price Filters (Optional)
Two optional smoothing methods can replace raw closing price throughout the trend calculation:
- Kalman Filter: a lightweight recursive estimator that continuously balances trust between the incoming price and its own prior estimate, adapting its responsiveness based on a fixed process/measurement noise ratio derived from your chosen length.
- LLAMA (Linear-Lag Adjusted Moving Average): a hybrid that takes a simple moving average and adjusts it by half the recent linear slope, aiming to reduce the lag inherent in plain moving averages.
These exist to give the trend filter a smoother, less noise-reactive input than raw closing price when desired.
• Regression Fair-Value Channel
On the most recent bar, the script performs a least-squares linear regression over a lookback window (either a fixed length, or a dynamic length measured from the most recent qualifying pivot, capped by "Max Lookback Cap") using hlc3 as the source. From this it derives the regression line itself, its standard deviation, and the Pearson correlation coefficient (R), which measures how well price actually fits a straight line over that window. Inner and outer channel bands are plotted at user-defined standard-deviation multiples above and below the regression line, giving a visual statistical envelope for the recent price trend.
• Correlation and ADX Filters
Two independent filters can suppress exhaustion signals when the broader trend lacks structural conviction:
- Pearson R Filter: when the absolute value of the regression's correlation coefficient falls below your threshold, the trend is considered statistically weak/directionless, and the channel is recolored neutral to flag this — though note this filter affects only the visual channel coloring, not signal firing.
- ADX Filter: when enabled, exhaustion signals are only permitted when ADX is at or above your threshold, filtering out exhaustion calls during periods of weak directional movement.
• Pivot Detection
Standard confirmed pivot highs and lows (requiring the specified number of bars on each side) are tracked internally to support the optional Dynamic Pivot Mode, which — when enabled — sizes the regression lookback to the distance since the most recent confirmed pivot rather than using a fixed length.
• ATR Trade Level Construction
When a qualifying exhaustion signal fires and is confirmed, the script computes a full trade plan: the entry is the closing price of the confirmed exhaustion bar, the stop-loss is placed one ATR-multiple away (your "ATR SL Multiplier" times ATR over "ATR Length"), and the resulting stop distance defines one Risk unit ("R"). Three take-profit levels are then placed at your chosen R-multiples (default 1R, 2R, 3R) from entry. This entire trade plan updates and redraws only when a new, unlocked exhaustion signal fires.
• Lock Signal
Enabling "Lock Signal" freezes the currently displayed trade plan on the chart, preventing new exhaustion events from overwriting the active levels — useful for manually tracking a single trade through to its conclusion without the visual being replaced mid-trade.
🎨 Visual Guide
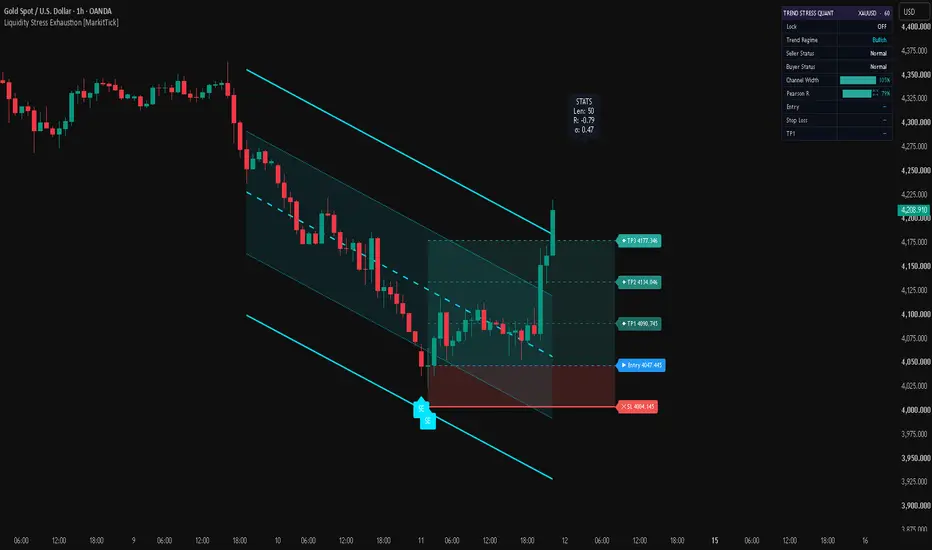
● Exhaustion Labels
- "SE" label below a bar (bullish color by default) marks a confirmed Seller Exhaustion event — sellers pushed price down under stress conditions, and the setup favors a potential upside reaction.
- "BE" label above a bar (bearish color by default) marks a confirmed Buyer Exhaustion event — buyers pushed price up under stress conditions, and the setup favors a potential downside reaction.
● Regression Channel
- The dashed center line is the linear regression fair-value line over the active lookback window.
- The two dotted inner lines mark the "Inner Deviation" band (default 1.0σ).
- The two solid outer lines mark the "Outer Deviation" band (default 2.0σ).
- The shaded fill between the inner bands is colored by trend direction — bullish or bearish color when the trend is statistically valid, neutral gray when the Pearson R Filter flags the trend as too weak/uncorrelated to trust.
- An optional floating "STATS" label above the current bar displays the regression length, Pearson R value, and current stress z-score (σ) numerically, when "Show Metrics Label" is enabled.
● Trade Level Lines
Plotted only after a qualifying exhaustion event, extending toward the current bar:
- Red solid line and "✕ SL" label: the calculated stop-loss.
- Blue dashed line and "▶ Entry" label: the entry price (signal bar's close).
- Three teal dashed lines of increasing opacity/solidity, with "◆ TP1", "✦ TP2", "◆ TP3" labels: the three R-multiple take-profit targets.
- A red-tinted fill between the stop and entry lines visualizes the risk zone.
- A teal-tinted fill between the entry and TP3 lines visualizes the reward zone.
● Dashboard (Table)
A compact panel, positioned per your "Dashboard Position" setting, reporting in real time: Lock status, current Trend Regime (Bullish/Bearish), Seller Status and Buyer Status (Exhausted/Normal), a visual Channel Width bar-meter (color-graded green/amber/red by relative width), a visual Pearson R bar-meter (same color grading by correlation strength), and — when an exhaustion signal is currently active — the live Entry, Stop Loss, and TP1 price levels. ADX value and Adaptive Filter type are appended as additional rows only when those features are enabled in the inputs.
📖 How to Use
- Watch for an "SE" (Seller Exhaustion) label — this suggests a downtrend that produced an unusually large price move for its volume, on a down candle, potentially signaling sellers are running out of conviction and a bounce could follow.
- Watch for a "BE" (Buyer Exhaustion) label — the mirror case in an uptrend, potentially signaling an approaching pullback or reversal.
- Use the dashboard's Pearson R and Channel Width meters as a quick sanity check on trend quality before acting on a signal — a low R reading (channel shown in neutral gray) suggests the recent price action lacks a clean directional structure.
- If ADX filtering is enabled, only signals occurring during sufficiently strong directional movement (per your threshold) will fire, which can help avoid exhaustion calls inside choppy, low-ADX conditions.
- Once a signal fires, the plotted SL/Entry/TP1-3 lines and the dashboard's live level readout offer a pre-built framework for position sizing and target-setting — always cross-check these levels against your own risk tolerance before acting on them.
- Enable "Lock Signal" if you want to study a single active trade plan without it being replaced by a new signal appearing on a later bar.
- All signals, dashboard values, and trade levels are calculated strictly on confirmed, closed bar data — nothing on this chart is repainted or recalculated retroactively into the past.
⚙️ Inputs and Settings
● Core Settings
- Trend Length: EMA period used for the directional trend filter. Longer values smooth out the trend classification; shorter values make it more reactive.
- Stats Lookback: rolling window for the illiquidity mean/standard deviation used to compute the stress z-score.
- Stress Threshold (σ): the z-score level that must be exceeded for a bar to be classified as "high stress." Raising this makes exhaustion signals rarer but more extreme.
- Dynamic Pivot Mode: when enabled, the regression channel's lookback length is derived from the distance to the most recent confirmed pivot instead of a fixed value.
- Fixed Length: the regression lookback used when Dynamic Pivot Mode is off.
- Pivot Left / Pivot Right: bars required on each side to confirm a swing high/low for Dynamic Pivot Mode.
- Max Lookback Cap: hard ceiling on the regression window length, regardless of pivot distance, to control computation and keep the channel visually relevant.
- Inner/Outer Deviation: standard-deviation multiples defining the two channel bands around the regression line.
● Filters
- Filter Weak Correlations / Pearson R Threshold: controls the channel's neutral-color flagging when regression fit quality is below this threshold.
- Use ADX Filter / ADX Threshold / ADX Length: optional directional-strength gate that must be satisfied for exhaustion signals to fire.
- Adaptive Filter (None / Kalman Filter / LLAMA) and its Length: optional pre-smoothing applied to price before the trend/EMA calculation.
● Trade Tools
- Lock Signal: freezes the current trade plan against being overwritten by new signals.
- ATR SL Multiplier / ATR Length: controls stop-loss distance as a multiple of ATR.
- TP1/TP2/TP3 (R Multiple): sets each take-profit target as a multiple of the initial risk (R).
● Visuals
- Show Metrics Label: toggles the floating STATS label showing regression length, R, and z-score.
- High/Low Volatility Width %: reference thresholds used to color-grade the dashboard's Channel Width meter.
- Line Extension: controls whether regression channel lines extend left, right, both, or not at all.
● Dashboard
- Dashboard Position: places the summary table in any of the four chart corners.
● Alerts
- Six customizable action-tag fields (Seller/Buyer Exhaustion, TP1/TP2/TP3 Hit, SL Hit) let you rename the "action" field inside each alert's JSON payload to match your own automation or webhook naming scheme.
● Colors
- Full palette control over bullish/bearish/neutral coloring, text and background colors, dashboard styling, and all trade-level line/fill colors.
🔍 Deconstruction of the Underlying Scientific and Academic Framework
● Illiquidity as a Price-Impact Proxy
The stress engine's core calculation — true range divided by volume — is a simplified, bar-by-bar adaptation of the price-impact style illiquidity measures used in market microstructure research, most notably the Amihud illiquidity ratio, which relates absolute returns to trading volume as a proxy for how much a given amount of volume "costs" in terms of price movement. The underlying academic intuition is that in illiquid or stressed conditions, smaller volumes produce disproportionately larger price swings; the log transform compresses the resulting distribution to reduce the influence of extreme outlier bars before standardization.
● Z-Score Standardization and Statistical Anomaly Detection
Converting the raw illiquidity reading into a z-score against its own rolling mean and standard deviation is a direct application of statistical process control / anomaly-detection theory: rather than using a fixed, market-agnostic threshold, the script defines "abnormal" relative to each instrument's and timeframe's own recent behavior. This adaptive standardization is a common approach in quantitative finance for regime and outlier detection, since raw price-impact values are not comparable across instruments, timeframes, or volatility regimes without normalization.
● Ordinary Least Squares Regression and Goodness-of-Fit
The fair-value channel is constructed using closed-form ordinary least-squares (OLS) regression formulas computed directly from the summary statistics of the price series (sums of x, y, x², xy, y²) rather than an iterative solver — a standard, numerically efficient approach for simple linear regression. The accompanying Pearson correlation coefficient is the classical goodness-of-fit statistic for this regression: it quantifies how well a straight line explains the price action over the lookback window, providing a principled, quantitative basis (rather than visual judgment) for deciding whether "trend" is a statistically meaningful description of recent price behavior.
● Recursive State Estimation (Kalman Filtering)
The optional Kalman Filter smoothing option is a simplified, single-dimension implementation of the classical Kalman filter from control theory and signal processing — a recursive Bayesian estimator that maintains a running estimate of a system's true state (here, price) and continuously updates it by weighting new observations against the model's own uncertainty. This provides a theoretically grounded alternative to fixed-window moving averages for noise reduction.
● Trend-Following Directional Strength (ADX/DMI)
The optional ADX filter draws on Welles Wilder's Directional Movement System, a long-established technical framework for separating trend strength from trend direction. Using it as a gate rather than a signal generator reflects its intended academic role: ADX does not indicate direction, only the strength of whatever directional move is present, making it a natural confluence filter for suppressing signals during structurally weak, low-conviction price action.
⚠️ Disclaimer
All provided scripts and indicators are strictly for educational exploration and must not be interpreted as financial advice or a recommendation to execute trades. We expressly disclaim all liability for any financial losses or damages that may result, directly or indirectly, from the reliance on or application of these tools. Market participation carries inherent risk where past performance never guarantees future returns, leaving all investment decisions and due diligence solely at your own discretion.

💡 Proprietary indicators. Original research. Built by analysts who trade.
📢 Free Telegram: t.me/MarkitTick_Updates
👑 Premium: TradingView Marketplace
📘 Guides: markittick.com
📢 Free Telegram: t.me/MarkitTick_Updates
👑 Premium: TradingView Marketplace
📘 Guides: markittick.com
면책사항
해당 정보와 게시물은 금융, 투자, 트레이딩 또는 기타 유형의 조언이나 권장 사항으로 간주되지 않으며, 트레이딩뷰에서 제공하거나 보증하는 것이 아닙니다. 자세한 내용은 이용 약관을 참조하세요.
💡 Proprietary indicators. Original research. Built by analysts who trade.
📢 Free Telegram: t.me/MarkitTick_Updates
👑 Premium: TradingView Marketplace
📘 Guides: markittick.com
📢 Free Telegram: t.me/MarkitTick_Updates
👑 Premium: TradingView Marketplace
📘 Guides: markittick.com
면책사항
해당 정보와 게시물은 금융, 투자, 트레이딩 또는 기타 유형의 조언이나 권장 사항으로 간주되지 않으며, 트레이딩뷰에서 제공하거나 보증하는 것이 아닙니다. 자세한 내용은 이용 약관을 참조하세요.