Live Multi-TF MA Alignment
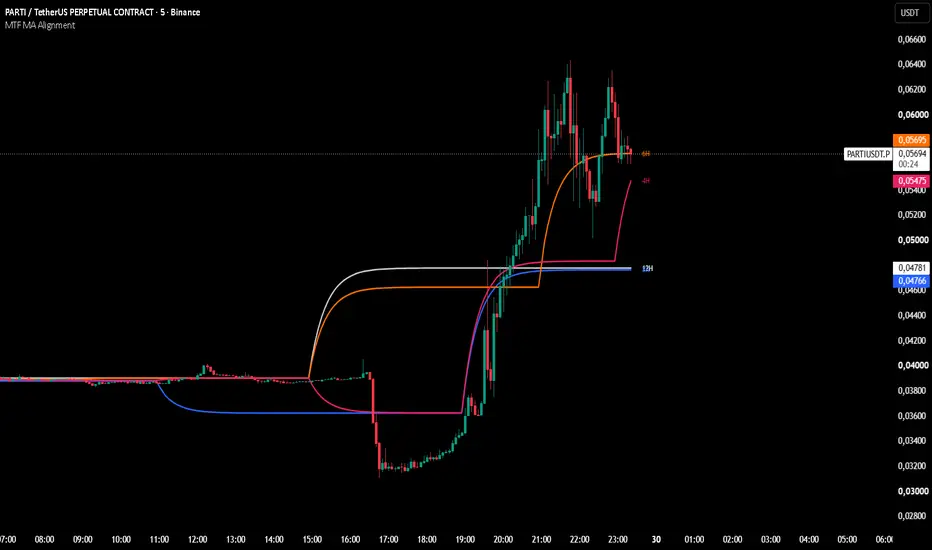
🚀 Live Multi-TF MA Alignment
✈️ There is no such thing as a signal in trading. There is no such thing as “buy” or “sell.” There is only price change, and what you choose to do about it.
👀 You are watching a drop on your chart. But what are the higher timeframes doing?
📉 On a low timeframe, price looks like it is falling. Candle after candle, it feels like the move down will never end. But on the higher timeframes, a rise may already be starting, and you cannot see it from where you are standing.
🔭 This indicator shows you exactly that. While you watch the small chart, the 4H, 6H, 8H and 12H lines tell you whether the bigger picture is still going down, or has started turning up. When the lines on the higher timeframes turn upward while price on your chart is still falling, you are seeing the early stage of a higher-timeframe move, before it is obvious on the small chart.
🔄 The same works in reverse: a rally on your chart can be happening while the higher timeframes are already rolling over.
🧭 Overview
This indicator plots four moving averages on your chart, each one fed by Heikin Ashi close data from a higher timeframe (12H, 8H, 6H and 4H by default). You can see how short, medium and longer-term trends line up in a single view, without switching charts.
⚡ Fully automatic: works on any chart timeframe
The higher timeframes are fixed, so there is nothing to calculate or adjust. Open the indicator on the 1-minute, 5-minute, 15-minute or 1-hour chart and you get the same 12H, 8H, 6H and 4H lines every time. No multipliers, no manual setup.
⚙️ How it works
🕐 Each line is tied to a fixed higher timeframe, independent of your chart timeframe.
🕯️ For each timeframe, the script requests the Heikin Ashi close and smooths it with the moving average of your choice.
🏷️ Each line has a small label at its right edge showing its timeframe.
📡 Lines update live as the higher-timeframe candle develops.
🎯 How to read it
🛫 Alignment: when the lines are stacked in order and fanning out, the timeframes agree on direction.
⚔️ Disagreement: when price is falling on your chart but the higher-timeframe lines are turning up (or the reverse), the timeframes are telling different stories. This is the moment the indicator is built to show.
🧲 Compression: when the lines bunch together, the timeframes are undecided, which often happens during consolidation or transitions.
🛡️ Dynamic support/resistance: price often reacts around these lines, especially the slower ones.
🛠️ Settings
⏱️ Line timeframes: defaults are 12H, 8H, 6H and 4H. You can change any of them.
📊 MA type: SMA, EMA, WMA or VWMA.
📏 MA length: smoothing length.
📝 Notes
👁️ A line is only drawn if its timeframe is equal to or higher than your chart timeframe. For example, on the 6H chart the 4H line is hidden, and on the daily chart all four lines are hidden.
🪜 Higher-timeframe data on a lower-timeframe chart moves in steps rather than as perfectly smooth curves. This is normal for multi-timeframe tools.
⚠️ The script uses lookahead on higher-timeframe data, so historical values may look cleaner than what you would have seen in real time. Do not judge it by past bars alone.
🧠 This is a visual analysis tool and does not guarantee any outcome. Use it with your own analysis and risk management.
🚨 Disclaimer
This indicator is provided for educational and informational purposes only. It is not financial, investment, or trading advice, and it is not a recommendation to buy or sell any asset. Trading financial markets involves substantial risk, and you can lose some or all of your capital. Past performance, including anything shown on historical bars, does not guarantee future results. The author makes no representations or warranties about the accuracy or reliability of this tool and accepts no liability for any loss or damage arising from its use. You are solely responsible for your own trading decisions. Always do your own research and consult a licensed financial professional before making any financial decision.
✈️ There is no such thing as a signal in trading. There is no such thing as “buy” or “sell.” There is only price change, and what you choose to do about it.
👀 You are watching a drop on your chart. But what are the higher timeframes doing?
📉 On a low timeframe, price looks like it is falling. Candle after candle, it feels like the move down will never end. But on the higher timeframes, a rise may already be starting, and you cannot see it from where you are standing.
🔭 This indicator shows you exactly that. While you watch the small chart, the 4H, 6H, 8H and 12H lines tell you whether the bigger picture is still going down, or has started turning up. When the lines on the higher timeframes turn upward while price on your chart is still falling, you are seeing the early stage of a higher-timeframe move, before it is obvious on the small chart.
🔄 The same works in reverse: a rally on your chart can be happening while the higher timeframes are already rolling over.
🧭 Overview
This indicator plots four moving averages on your chart, each one fed by Heikin Ashi close data from a higher timeframe (12H, 8H, 6H and 4H by default). You can see how short, medium and longer-term trends line up in a single view, without switching charts.
⚡ Fully automatic: works on any chart timeframe
The higher timeframes are fixed, so there is nothing to calculate or adjust. Open the indicator on the 1-minute, 5-minute, 15-minute or 1-hour chart and you get the same 12H, 8H, 6H and 4H lines every time. No multipliers, no manual setup.
⚙️ How it works
🕐 Each line is tied to a fixed higher timeframe, independent of your chart timeframe.
🕯️ For each timeframe, the script requests the Heikin Ashi close and smooths it with the moving average of your choice.
🏷️ Each line has a small label at its right edge showing its timeframe.
📡 Lines update live as the higher-timeframe candle develops.
🎯 How to read it
🛫 Alignment: when the lines are stacked in order and fanning out, the timeframes agree on direction.
⚔️ Disagreement: when price is falling on your chart but the higher-timeframe lines are turning up (or the reverse), the timeframes are telling different stories. This is the moment the indicator is built to show.
🧲 Compression: when the lines bunch together, the timeframes are undecided, which often happens during consolidation or transitions.
🛡️ Dynamic support/resistance: price often reacts around these lines, especially the slower ones.
🛠️ Settings
⏱️ Line timeframes: defaults are 12H, 8H, 6H and 4H. You can change any of them.
📊 MA type: SMA, EMA, WMA or VWMA.
📏 MA length: smoothing length.
📝 Notes
👁️ A line is only drawn if its timeframe is equal to or higher than your chart timeframe. For example, on the 6H chart the 4H line is hidden, and on the daily chart all four lines are hidden.
🪜 Higher-timeframe data on a lower-timeframe chart moves in steps rather than as perfectly smooth curves. This is normal for multi-timeframe tools.
⚠️ The script uses lookahead on higher-timeframe data, so historical values may look cleaner than what you would have seen in real time. Do not judge it by past bars alone.
🧠 This is a visual analysis tool and does not guarantee any outcome. Use it with your own analysis and risk management.
🚨 Disclaimer
This indicator is provided for educational and informational purposes only. It is not financial, investment, or trading advice, and it is not a recommendation to buy or sell any asset. Trading financial markets involves substantial risk, and you can lose some or all of your capital. Past performance, including anything shown on historical bars, does not guarantee future results. The author makes no representations or warranties about the accuracy or reliability of this tool and accepts no liability for any loss or damage arising from its use. You are solely responsible for your own trading decisions. Always do your own research and consult a licensed financial professional before making any financial decision.

For help and support, feel free to contact:
wa.me/905469061306
wa.me/905469061306
면책사항
해당 정보와 게시물은 금융, 투자, 트레이딩 또는 기타 유형의 조언이나 권장 사항으로 간주되지 않으며, 트레이딩뷰에서 제공하거나 보증하는 것이 아닙니다. 자세한 내용은 이용 약관을 참조하세요.
For help and support, feel free to contact:
wa.me/905469061306
wa.me/905469061306
면책사항
해당 정보와 게시물은 금융, 투자, 트레이딩 또는 기타 유형의 조언이나 권장 사항으로 간주되지 않으며, 트레이딩뷰에서 제공하거나 보증하는 것이 아닙니다. 자세한 내용은 이용 약관을 참조하세요.