OPEN-SOURCE SCRIPT
Bollinger Bands Squeeze (BB inside KC)
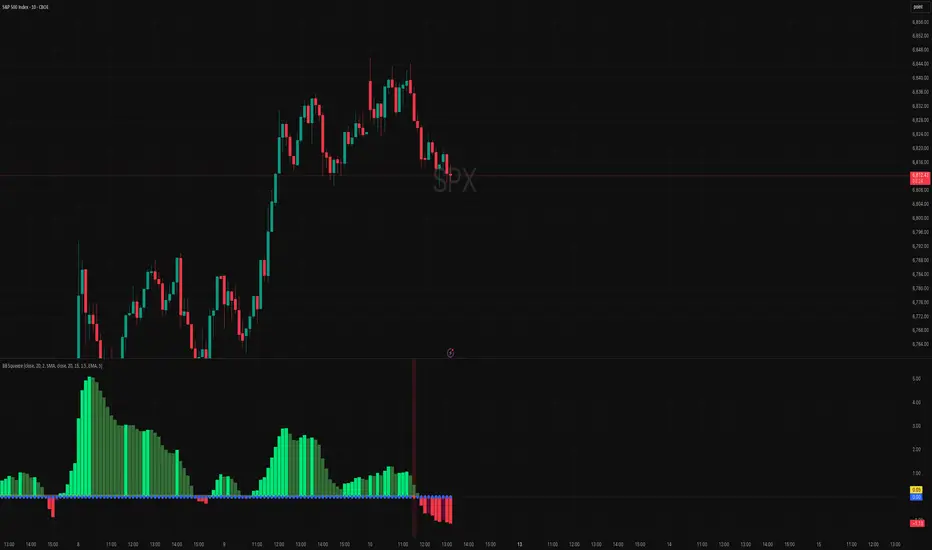
Bollinger Bands Squeeze (BB inside KC) — With Momentum Histogram and Squeeze Intensity
A volatility squeeze indicator that detects when Bollinger Bands contract inside Keltner Channels, enhanced with two original features: a momentum histogram showing breakout direction, and a squeeze intensity meter showing how tightly coiled the squeeze is. Together, these answer three questions at a glance: Is there a squeeze? How tight is it? Which direction on release?
What Makes This Original
This indicator goes beyond simple squeeze detection in three ways that existing BB squeeze scripts do not:
How the Components Work Together
The three layers provide a complete volatility breakout framework:
The key signal is: high squeeze intensity (tight compression) combined with momentum bars changing color (direction shift). This convergence marks the transition from compression to expansion — the moment when the coiled energy releases.
How It Works
Squeeze Detection:
Squeeze Intensity:
Momentum Histogram:
How to Use
Breakout setup: Look for red dots (squeeze ON) with rising squeeze intensity (yellow area growing). This is the compression phase — volatility is coiling.
Direction bias: While in the squeeze, watch the momentum histogram. Green bars suggest the breakout will be to the upside. Red bars suggest downside. The transition from dark to bright color confirms acceleration in that direction.
Entry timing: The shift from red dot to blue dot (squeeze release) combined with bright momentum bars is the signal. Enter in the direction of the momentum with the squeeze release as confirmation.
Timeframe tuning: On lower timeframes (1-15m), consider switching both BB and KC basis to EMA and reducing the momentum smoothing length for faster response. On daily charts, the default SMA/EMA configuration works well.
Default Parameters
Alerts
Visual Output
A volatility squeeze indicator that detects when Bollinger Bands contract inside Keltner Channels, enhanced with two original features: a momentum histogram showing breakout direction, and a squeeze intensity meter showing how tightly coiled the squeeze is. Together, these answer three questions at a glance: Is there a squeeze? How tight is it? Which direction on release?
What Makes This Original
This indicator goes beyond simple squeeze detection in three ways that existing BB squeeze scripts do not:
- Squeeze Intensity (0-100%) — Most squeeze indicators are binary: ON or OFF. This version measures HOW compressed the BB is relative to the KC, expressed as a percentage. A 90% intensity means the BB bands are barely visible inside the KC — maximum coiled energy. A 20% intensity means the bands are just inside — weak compression. This lets traders distinguish between powerful breakout setups and marginal ones. The formula is: (1 - bbWidth / kcWidth) x 100.
- KC-Normalized Momentum Histogram — Rather than using linear regression (the standard TTM approach), this momentum is calculated as the displacement of close from the Keltner Channel midline, normalized by ATR and smoothed with a configurable EMA. This ties the momentum reading directly to the same channel that defines the squeeze, creating a self-consistent system. The four-color scheme shows both direction and acceleration at a glance.
- Full BB/KC Independence — Each component (BB and KC) has its own configurable MA type (SMA or EMA), source, and lookback period. The ATR period for KC range is decoupled from the KC basis length. This allows fine-tuning squeeze sensitivity for different assets and timeframes.
How the Components Work Together
The three layers provide a complete volatility breakout framework:
- Squeeze dots (red/blue) tell you WHEN volatility is compressed — the setup phase
- Squeeze intensity (yellow area) tells you HOW MUCH energy is stored — higher intensity means stronger potential breakout
- Momentum histogram (green/red bars) tells you WHICH DIRECTION the breakout is developing — so you can position before the move completes
The key signal is: high squeeze intensity (tight compression) combined with momentum bars changing color (direction shift). This convergence marks the transition from compression to expansion — the moment when the coiled energy releases.
How It Works
Squeeze Detection:
- Squeeze ON (red dot): BB upper band <= KC upper band AND BB lower band >= KC lower band
- Squeeze OFF (blue dot): BB bands have expanded beyond KC bands
Squeeze Intensity:
- Measures the ratio of BB width to KC width during a squeeze
- 100% = BB bands are fully collapsed inside KC (maximum compression)
- 0% = BB bands are at the same width as KC (boundary — squeeze about to release)
- Only displayed during active squeeze (red dots)
Momentum Histogram:
- Raw value: (close - KC midline) / ATR — measures price displacement from the channel center, normalized by volatility
- Smoothed with a configurable EMA (default: 5) to reduce noise
- Four-color scheme:
- Bright green: positive and increasing (bullish acceleration)
- Dark green: positive and decreasing (bullish deceleration)
- Bright red: negative and decreasing (bearish acceleration)
- Dark red: negative and increasing (bearish deceleration)
How to Use
Breakout setup: Look for red dots (squeeze ON) with rising squeeze intensity (yellow area growing). This is the compression phase — volatility is coiling.
Direction bias: While in the squeeze, watch the momentum histogram. Green bars suggest the breakout will be to the upside. Red bars suggest downside. The transition from dark to bright color confirms acceleration in that direction.
Entry timing: The shift from red dot to blue dot (squeeze release) combined with bright momentum bars is the signal. Enter in the direction of the momentum with the squeeze release as confirmation.
Timeframe tuning: On lower timeframes (1-15m), consider switching both BB and KC basis to EMA and reducing the momentum smoothing length for faster response. On daily charts, the default SMA/EMA configuration works well.
Default Parameters
- BB: Source=Close, Lookback=20, StdDev=2.0, Basis=SMA
- KC: Source=Close, Lookback=20, ATR Period=15, ATR Mult=1.5, Basis=EMA
- Momentum Smoothing: 5
- All visual elements enabled by default
Alerts
- Squeeze Started — BB bands just contracted inside KC (new squeeze begins)
- Squeeze Released — BB bands just expanded beyond KC (breakout in progress)
- Squeeze ON — currently in squeeze
- Squeeze OFF — currently not in squeeze
Visual Output
- Red background tint: entire pane background highlights during active squeeze — impossible to miss even with a busy histogram (configurable color and toggle)
- Colored histogram bars: momentum direction and acceleration
- Yellow shaded area: squeeze intensity (visible only during active squeeze)
- Colored dots on zero line: red = squeeze ON, blue = squeeze OFF
오픈 소스 스크립트
트레이딩뷰의 진정한 정신에 따라, 이 스크립트의 작성자는 이를 오픈소스로 공개하여 트레이더들이 기능을 검토하고 검증할 수 있도록 했습니다. 작성자에게 찬사를 보냅니다! 이 코드는 무료로 사용할 수 있지만, 코드를 재게시하는 경우 하우스 룰이 적용된다는 점을 기억하세요.

면책사항
해당 정보와 게시물은 금융, 투자, 트레이딩 또는 기타 유형의 조언이나 권장 사항으로 간주되지 않으며, 트레이딩뷰에서 제공하거나 보증하는 것이 아닙니다. 자세한 내용은 이용 약관을 참조하세요.
오픈 소스 스크립트
트레이딩뷰의 진정한 정신에 따라, 이 스크립트의 작성자는 이를 오픈소스로 공개하여 트레이더들이 기능을 검토하고 검증할 수 있도록 했습니다. 작성자에게 찬사를 보냅니다! 이 코드는 무료로 사용할 수 있지만, 코드를 재게시하는 경우 하우스 룰이 적용된다는 점을 기억하세요.
면책사항
해당 정보와 게시물은 금융, 투자, 트레이딩 또는 기타 유형의 조언이나 권장 사항으로 간주되지 않으며, 트레이딩뷰에서 제공하거나 보증하는 것이 아닙니다. 자세한 내용은 이용 약관을 참조하세요.