EMA 9/21/50 Band
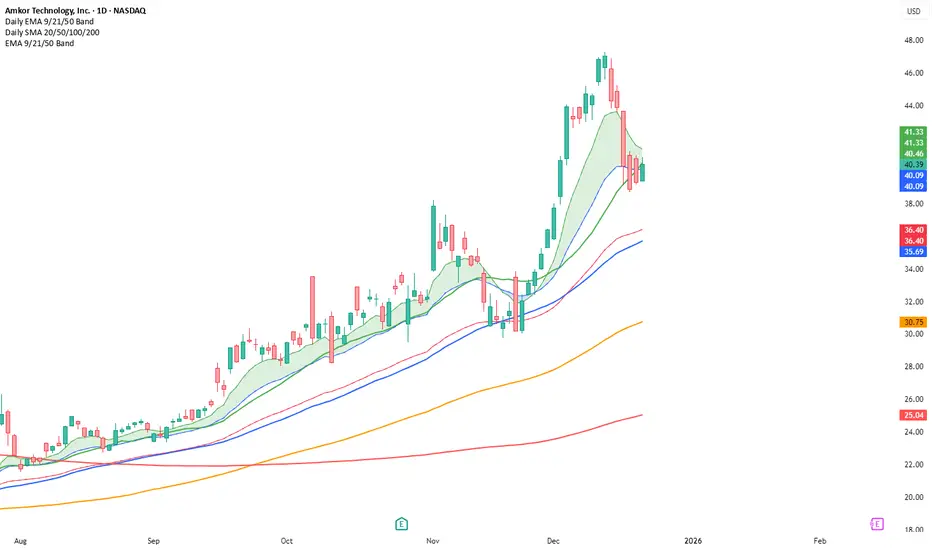
EMA band indicator plotting the 9, 21, and 50 exponential moving averages based on the **active chart timeframe**. Designed to adapt dynamically as you change timeframes, helping visualize short-term momentum, trend alignment, and dynamic support and resistance. Useful for identifying trend strength, pullbacks, and momentum shifts without anchoring to a fixed higher timeframe.

면책사항
해당 정보와 게시물은 금융, 투자, 트레이딩 또는 기타 유형의 조언이나 권장 사항으로 간주되지 않으며, 트레이딩뷰에서 제공하거나 보증하는 것이 아닙니다. 자세한 내용은 이용 약관을 참조하세요.
면책사항
해당 정보와 게시물은 금융, 투자, 트레이딩 또는 기타 유형의 조언이나 권장 사항으로 간주되지 않으며, 트레이딩뷰에서 제공하거나 보증하는 것이 아닙니다. 자세한 내용은 이용 약관을 참조하세요.