OPEN-SOURCE SCRIPT
Variable Sine Wave Fit [LuxAlgo]
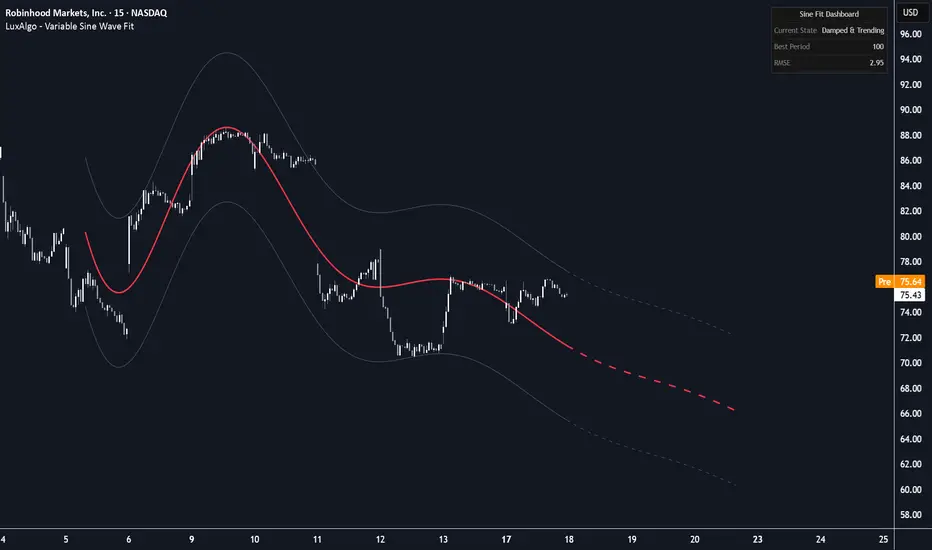
The Variable Sine Wave Fit indicator uses Ordinary Least Squares (OLS) to fit a dynamic, damped, or expanding sine wave with an underlying linear trend to recent price action. This tool aims to identify cyclical patterns and project their potential continuation into the future, providing a mathematical framework for understanding market regimes and turning points.
🔶 USAGE
The indicator fits a complex trigonometric model to the price data within a user-defined window. The resulting fit is displayed as a solid line over historical bars and transitions into a dashed extrapolation for the forecasted period.
To use the indicator effectively, traders should observe the relationship between the price and the RMSE bands. If the price remains within these bands, the current cyclical model is considered to be tracking the price action effectively. If the price breaks significantly outside, the cycle may be shifting or breaking down.
🔹 Extrema Markers
Small dot markers are placed at the local maxima and minima of the dashed forecast line. These serve as visual guides for the timing of potential future turning points based on the current mathematical fit.
🔹 Market Regime Dashboard
The dashboard provides a real-time summary of the fitted model's characteristics:
🔶 DETAILS
The script solves for the best parameters of the following equation:
y = e^(λ * t) * (a * sin(ω * t) + b * cos(ω * t)) + m * t + c
Where:
The "Best Period" is determined through a grid search that minimizes the Sum of Squared Errors (SSE), ensuring the frequency (ω) matches the most dominant local cycle within the search range.
🔶 SETTINGS
🔹 Settings
🔹 Visuals
🔹 Dashboard
This indicator is subject to repainting and is displayed retrospectively.
🔶 USAGE
The indicator fits a complex trigonometric model to the price data within a user-defined window. The resulting fit is displayed as a solid line over historical bars and transitions into a dashed extrapolation for the forecasted period.
To use the indicator effectively, traders should observe the relationship between the price and the RMSE bands. If the price remains within these bands, the current cyclical model is considered to be tracking the price action effectively. If the price breaks significantly outside, the cycle may be shifting or breaking down.
🔹 Extrema Markers
Small dot markers are placed at the local maxima and minima of the dashed forecast line. These serve as visual guides for the timing of potential future turning points based on the current mathematical fit.
🔹 Market Regime Dashboard
The dashboard provides a real-time summary of the fitted model's characteristics:
- State: Classified based on the amplitude behavior (Damped, Expanding, or Constant) and the linear component (Trending or Ranging).
- Best Period: The cycle length (in bars) that currently provides the best fit to the data.
- RMSE: The Root Mean Square Error, representing the average deviation of price from the fit.
🔶 DETAILS
The script solves for the best parameters of the following equation:
y = e^(λ * t) * (a * sin(ω * t) + b * cos(ω * t)) + m * t + c
Where:
- e^(λ * t): The damping/expansion factor. If λ > 0, the cycle is expanding; if λ < 0, it is damping.
- a, b: Coefficients determining the phase and initial amplitude of the sine wave.
- m * t + c: A linear regression component that accounts for the underlying price trend.
The "Best Period" is determined through a grid search that minimizes the Sum of Squared Errors (SSE), ensuring the frequency (ω) matches the most dominant local cycle within the search range.
🔶 SETTINGS
🔹 Settings
- Window Size (N): The number of historical bars used to calculate the fit.
- Auto Period: When enabled, the script searches for the best period within the specified min/max range.
- Fixed Period (P): The period used if Auto Period is disabled.
- Min/Max Search Period: Defines the boundaries for the automatic cycle search.
- Forecast Length: The number of bars to project the fit into the future.
- RMSE Band Multiplier: Determines the width of the bands surrounding the fit based on the fit error.
🔹 Visuals
- Bullish/Bearish Color: Colors used for the fit line and extrema markers based on the final slope.
- Band Color: The color of the RMSE-based envelope.
🔹 Dashboard
- Dashboard: Toggles the visibility of the data table.
- Position: Moves the dashboard to different corners of the chart.
- Size: Adjusts the text and table scale.
오픈 소스 스크립트
트레이딩뷰의 진정한 정신에 따라, 이 스크립트의 작성자는 이를 오픈소스로 공개하여 트레이더들이 기능을 검토하고 검증할 수 있도록 했습니다. 작성자에게 찬사를 보냅니다! 이 코드는 무료로 사용할 수 있지만, 코드를 재게시하는 경우 하우스 룰이 적용된다는 점을 기억하세요.

All content & scripts provided by LuxAlgo are for educational purposes only and are not financial advice.
면책사항
해당 정보와 게시물은 금융, 투자, 트레이딩 또는 기타 유형의 조언이나 권장 사항으로 간주되지 않으며, 트레이딩뷰에서 제공하거나 보증하는 것이 아닙니다. 자세한 내용은 이용 약관을 참조하세요.
오픈 소스 스크립트
트레이딩뷰의 진정한 정신에 따라, 이 스크립트의 작성자는 이를 오픈소스로 공개하여 트레이더들이 기능을 검토하고 검증할 수 있도록 했습니다. 작성자에게 찬사를 보냅니다! 이 코드는 무료로 사용할 수 있지만, 코드를 재게시하는 경우 하우스 룰이 적용된다는 점을 기억하세요.
면책사항
해당 정보와 게시물은 금융, 투자, 트레이딩 또는 기타 유형의 조언이나 권장 사항으로 간주되지 않으며, 트레이딩뷰에서 제공하거나 보증하는 것이 아닙니다. 자세한 내용은 이용 약관을 참조하세요.