업데이트됨
[blackcat] L2 Market Facilitation Index
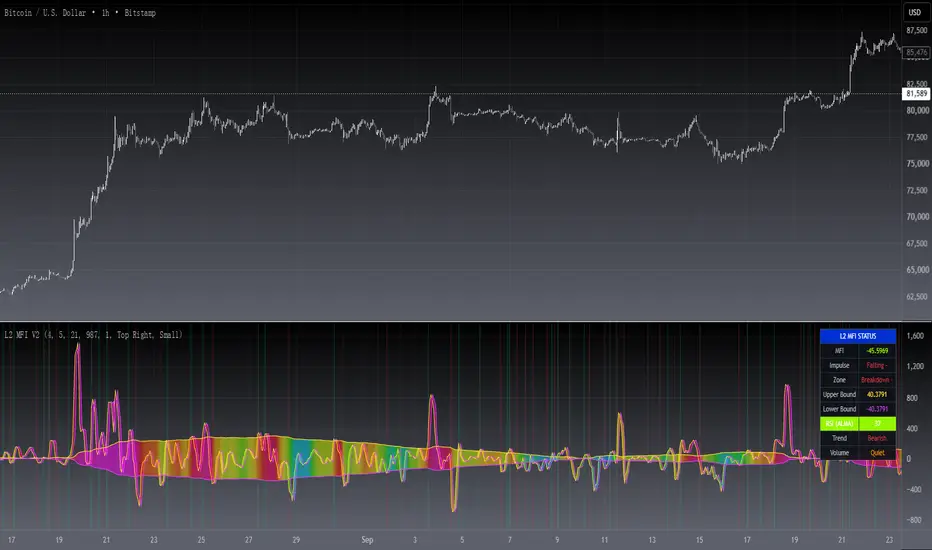
The Market Facilitation Index (MFI) is a technical indicator that measures the ease with which the market is able to move based on the volume traded. It was developed by Dr. Bill Williams as part of his trading system.
The MFI is calculated by taking into account the difference between the current typical price (average of high, low, and close) and the previous typical price, multiplied by the volume. This difference is then divided by the sum of volume over a specified period.
The MFI helps traders to identify periods of high or low market facilitation. High MFI values indicate that the market is facilitating trade and moving with ease, suggesting increased activity and potential trading opportunities. Conversely, low MFI values suggest a lack of market facilitation, indicating decreased activity and potential consolidation or sideways movement.
Traders can use the MFI in conjunction with other technical indicators and price analysis techniques to make informed trading decisions. It can be used to confirm trends, identify potential reversals, and assess the strength of market movements.
The Market Facilitation Index provides valuable insights into market dynamics, as it focuses on the relationship between price movement and trading volume. By incorporating volume data into its calculations, the MFI captures the impact of volume on market activity.
This indicator is particularly useful in identifying periods of market consolidation or range-bound trading. When the MFI shows low values, it suggests that market participants are hesitant and there may be a lack of clear trends. Traders can interpret this as a potential signal to avoid entering new positions or to tighten their stop-loss levels.
Conversely, when the MFI indicates high values, it signifies that the market is experiencing high levels of activity and price movement. This can be an indication of a strong trend, and traders may look for opportunities to enter positions in line with the prevailing market direction.
In addition to identifying market trends and potential reversals, the MFI can also help traders gauge the strength of price movements. By comparing the MFI values during different price swings or trends, traders can assess whether the market is experiencing increasing or decreasing levels of facilitation. This information can be valuable in determining the overall momentum and sustainability of a trend.
It's important to note that while the Market Facilitation Index can be a useful tool in technical analysis, it should not be used in isolation. Like any indicator, it has its limitations and may not always accurately reflect market conditions. Therefore, it is advisable to combine the MFI with other technical indicators, chart patterns, and fundamental analysis to gain a more comprehensive understanding of the market.
In conclusion, the Market Facilitation Index is a powerful technical indicator that measures the ease with which the market is able to move based on trading volume. It helps traders identify periods of high or low market facilitation, confirm trends, identify potential reversals, and assess the strength of market movements. However, it should be used in conjunction with other analysis methods for comprehensive market evaluation.
The MFI is calculated by taking into account the difference between the current typical price (average of high, low, and close) and the previous typical price, multiplied by the volume. This difference is then divided by the sum of volume over a specified period.
The MFI helps traders to identify periods of high or low market facilitation. High MFI values indicate that the market is facilitating trade and moving with ease, suggesting increased activity and potential trading opportunities. Conversely, low MFI values suggest a lack of market facilitation, indicating decreased activity and potential consolidation or sideways movement.
Traders can use the MFI in conjunction with other technical indicators and price analysis techniques to make informed trading decisions. It can be used to confirm trends, identify potential reversals, and assess the strength of market movements.
The Market Facilitation Index provides valuable insights into market dynamics, as it focuses on the relationship between price movement and trading volume. By incorporating volume data into its calculations, the MFI captures the impact of volume on market activity.
This indicator is particularly useful in identifying periods of market consolidation or range-bound trading. When the MFI shows low values, it suggests that market participants are hesitant and there may be a lack of clear trends. Traders can interpret this as a potential signal to avoid entering new positions or to tighten their stop-loss levels.
Conversely, when the MFI indicates high values, it signifies that the market is experiencing high levels of activity and price movement. This can be an indication of a strong trend, and traders may look for opportunities to enter positions in line with the prevailing market direction.
In addition to identifying market trends and potential reversals, the MFI can also help traders gauge the strength of price movements. By comparing the MFI values during different price swings or trends, traders can assess whether the market is experiencing increasing or decreasing levels of facilitation. This information can be valuable in determining the overall momentum and sustainability of a trend.
It's important to note that while the Market Facilitation Index can be a useful tool in technical analysis, it should not be used in isolation. Like any indicator, it has its limitations and may not always accurately reflect market conditions. Therefore, it is advisable to combine the MFI with other technical indicators, chart patterns, and fundamental analysis to gain a more comprehensive understanding of the market.
In conclusion, the Market Facilitation Index is a powerful technical indicator that measures the ease with which the market is able to move based on trading volume. It helps traders identify periods of high or low market facilitation, confirm trends, identify potential reversals, and assess the strength of market movements. However, it should be used in conjunction with other analysis methods for comprehensive market evaluation.
릴리즈 노트
OVERVIEWThe [blackcat] L2 Market Facilitation Index (MFI) indicator is designed to measure the ease of market movement by analyzing price changes and trading volumes. This script calculates a unique MFI value that helps traders identify trends and potential reversals based on market facilitation. With customizable parameters and gradient coloring for better visualization, it provides insights into market dynamics 📊💹.
FEATURES
Calculates Typical Price using high, low, and closing prices.
Computes Volume Difference based on typical price changes and volume.
Determines the Market Facilitation Index (MFI) using an Adaptive Linear Moving Average (ALMA).
Generates a dynamic Color Gradient based on Relative Strength Index (RSI) values:
Colors range from blue to red, indicating different levels of market strength.
Plots the MFI line with gradient fill for enhanced visual representation.
Includes adjustable Upper Bound and Lower Bound lines to define sideways markets.
Provides clear visual cues for trend identification and potential reversal points 🎯
HOW TO USE
Add the indicator to your TradingView chart by selecting it from the indicators list.
Adjust the Sideways Scaler parameter to fine-tune the sensitivity of the bounds.
Observe the plotted MFI line and its gradient colors to assess market conditions.
Use the upper and lower bound lines as references for identifying sideways movements.
Combine this indicator with other tools for confirmation before making trading decisions.
LIMITATIONS
The indicator may generate false signals in highly volatile or ranging markets 🌪️.
Users should test different settings to find optimal parameters for their specific assets and timeframes.
The effectiveness of the indicator may vary across different market conditions.
NOTES
Ensure that you have sufficient historical data available for accurate calculations.
Test the indicator thoroughly on demo accounts before applying it to live trading 🔍.
Experiment with various scalers to achieve the desired balance between responsiveness and stability.
릴리즈 노트
█ OVERVIEWL2 Market Facilitation Index V2 is a volume-weighted momentum oscillator that measures how strongly price movement is being facilitated by volume. A rainbow heatmap between the index and its 2-bar lag exposes impulse direction at a glance, while a self-adapting sideways band flags volatility expansions.
█ CONCEPTS
The index is built on three layers:
• Volume impulse: the 5-bar sum of typical-price change multiplied by volume, normalized by the 5-bar volume sum and smoothed with an ALMA filter — a responsive measure of who is moving price.
• Rainbow gradient: RSI(21) applied to an ALMA(21) of close maps every bar to a 101-color scale (blue → green → yellow → red), coloring the fill between the index and its lag.
• Sideways band: a symmetric envelope at ±|ALMA(987)| × scaler adapts to each symbol's own rhythm; excursions outside it mark unusual activity.
Key principles:
• Wide, brightly colored fill = strong volume-backed impulse.
• Narrow fill near zero = fading participation, sideways drift.
• Index above the upper bound = bullish volatility expansion; below the lower bound = bearish expansion.
█ HOW TO USE
1 — Add the indicator to any symbol with volume data; it runs in a separate pane.
2 — Watch the heatmap: green-to-yellow rising fill favors trend continuation, red falling fill warns of distribution.
3 — Read the status table for the current state, and set alerts on band breakouts or zero-line impulse flips.
Input Parameters
• Sideways Scaler (default 4): band width multiplier.
• MFI Sum Length (default 5): volume-impulse summation window.
• RSI Length (default 21): period of the gradient-driving RSI.
• Sideways ALMA Length (default 987): long baseline for the band.
• Visualization toggles: heatmap fill, band fill, breakout background, line width.
• Status Table: show/hide, position (six anchors), text size.
█ FEATURES
• Live status table: MFI value, impulse state, zone state, band bounds, RSI(ALMA) with gradient-colored cell, trend bias and volume regime (Surge / Above Avg / Normal / Quiet).
• Background flashes on band breakouts and breakdowns.
• Four alertcondition alerts: Zone Breakout, Zone Breakdown, Impulse Flip Up, Impulse Flip Down.
• V2 engine hardening: v6 upgrade, symmetric band that no longer collapses when the baseline drifts negative, division-by-zero guards, and safe warm-up handling of the color array.
█ VISUAL STATES
• Rising + / Falling - / Flat =: impulse direction of the index versus its 2-bar lag.
• Breakout + / Breakdown - / Sideways =: position of the index relative to the adaptive band.
• Bullish / Bearish / Neutral: gradient trend bias from RSI(ALMA) thresholds (55 / 45).
█ IMPLEMENTATION NOTES
Open source. Uses only built-ins: ta.alma, ta.rsi, ta.sma, ta.crossover / ta.crossunder, math.sum. Cross calculations run unconditionally so lazy v6 evaluation cannot corrupt their history. No request.security is used: nothing repaints after bar close.
█ LIMITATIONS
• Requires symbols with volume data; no volume = no valid reading.
• The band needs roughly 1000 bars of history before it appears.
• Index scale is instrument-dependent — compare readings relative to the band, not across symbols.
• This is an analytical research tool, not a standalone trading system; always combine with price structure and risk management.
█ NOTES
• V2 refinement of the original blackcat L2 Market Facilitation Index by blackcat1402, published under the Mozilla Public License 2.0.
• Suggestions and feedback are welcome in the comments section.
════════════════════════════════════════════════════════════════════════
For questions or feedback, please use the comments section below.
Feel free to use and modify — attribution appreciated.

Don't miss out! The first and most important thing to do is to join my Discord chat now! Click here to start your adventure: discord.com/invite/ZTGpQJq My new github for more pine development soon: github.com/wxt-coder
면책사항
해당 정보와 게시물은 금융, 투자, 트레이딩 또는 기타 유형의 조언이나 권장 사항으로 간주되지 않으며, 트레이딩뷰에서 제공하거나 보증하는 것이 아닙니다. 자세한 내용은 이용 약관을 참조하세요.
Don't miss out! The first and most important thing to do is to join my Discord chat now! Click here to start your adventure: discord.com/invite/ZTGpQJq My new github for more pine development soon: github.com/wxt-coder
면책사항
해당 정보와 게시물은 금융, 투자, 트레이딩 또는 기타 유형의 조언이나 권장 사항으로 간주되지 않으며, 트레이딩뷰에서 제공하거나 보증하는 것이 아닙니다. 자세한 내용은 이용 약관을 참조하세요.