업데이트됨
Titpaud Pivot Channel MTF
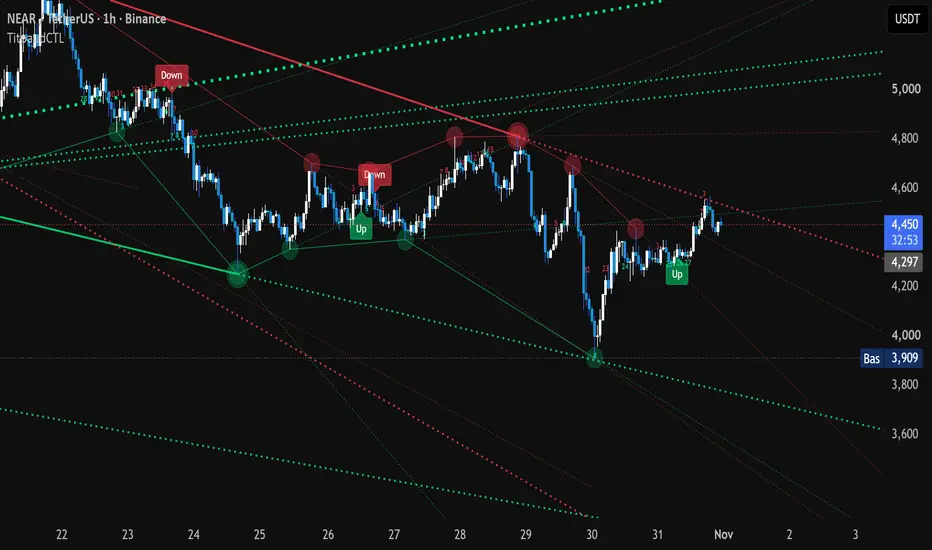
TITLE : Titpaud Multi-Scale Pivot Channel
CREDITS AND LICENSE
This script is based on "Pivot Channel TrendLines" by BigBeluga, published open source on TradingView under the Creative Commons Attribution-NonCommercial-ShareAlike 4.0 license. Full credit for the original pivot channel logic goes to BigBeluga: pivot detection, the zigzag between pivots of the same kind, the extension of falling highs and rising lows separated by at least one ATR, the Up / Down breakout labels and the last pivot price dashes. This version is published open source under the same license, for non-commercial use.
WHAT IT DOES
The script draws the pivot channel of the original indicator at several scales at once, on the same chart. A pivot that is k times larger behaves much like the same pivot on a timeframe k times larger (one 4h bar holds four 1h bars). So instead of switching timeframes, you see the small structure and the larger structures on top of each other.
Three layers are computed on the chart timeframe:
- Layer x1: pivot lookback 15 (the original setting), thin lines.
- Layer x4: pivot lookback 15 x 4 = 60, close to a timeframe four times larger (4h on a 1h chart), thicker lines.
- Layer x16: pivot lookback 15 x 16 = 240, close to a timeframe sixteen times larger, thickest lines.
The factor of each layer can be changed. For each layer, the extension length is multiplied by its factor and the minimum distance between two pivots (ATR 200) is multiplied by the square root of the factor, because the range of a bar grows roughly with the square root of its duration.
WHAT IS NEW COMPARED WITH THE ORIGINAL
- Multi-scale layers: up to three pivot channels of different sizes drawn together, each with its own width, transparency and labels.
- One Up / Down label per layer: the labels of the small layer no longer erase the labels of the larger layers. The labels of the larger layers read "Up x4", "Down x16" and so on.
- Latest lines extended in any direction: the original only extends falling highs and rising lows. A new setting also extends the N latest lines of each side, whatever their direction (1 = latest lines only, 0 = off, a large number = all lines). These extra extensions draw no Up / Down label, so the breakout signals still follow the original rule.
- Long extensions: TradingView cannot draw more than 500 bars into the future. Extensions longer than that are drawn up to the limit and lengthened bar after bar, so large layers and long extensions work without errors.
- Optional pivot dots (hidden by default) and separate colors for highs and lows.
HOW TO USE IT
- The thick lines of the larger layers show the main structure: rising lows act as support, falling highs as resistance.
- The thin lines of the x1 layer show the current swings inside that structure.
- Places where lines of several layers meet are the zones where the structures of several scales agree.
- An Up label means a close above an extended falling high line, a Down label means a close below an extended rising low line, on the layer named in the label.
SETTINGS
Base settings: pivot lookback of the x1 layer, extension length of the x1 layer (other layers multiply it), extension line style, pivot high and low colors, pivot dots, number of latest lines extended in any direction.
Layer x1 / x4 / x16: show the layer, factor (x4 and x16), line width, transparency, Up and Down labels.
Last pivot price: horizontal dashes and price labels on the latest high and low pivots of the x1 layer.
LIMITS
- Pivots are confirmed late and drawn in the past: a pivot appears only after its lookback has passed, 15 bars later on the x1 layer, 60 bars on x4 and 240 bars on x16. The lines and labels on the past part of the chart were not visible in real time at the place where they are drawn.
- The larger layers are an approximation of higher timeframes built on the chart timeframe; they are not the exact pivots of those timeframes and the script does not request other timeframes.
- The larger the layer, the fewer the pivots and the fewer the Up / Down labels; on a short history the x16 layer can show very few lines.
- The Up / Down labels are visual breakout marks, not a trading system. No performance is claimed. Use them with your own analysis and risk management.
- TradingView keeps at most 500 lines and 500 labels per script: on long histories the oldest drawings are removed.
CREDITS AND LICENSE
This script is based on "Pivot Channel TrendLines" by BigBeluga, published open source on TradingView under the Creative Commons Attribution-NonCommercial-ShareAlike 4.0 license. Full credit for the original pivot channel logic goes to BigBeluga: pivot detection, the zigzag between pivots of the same kind, the extension of falling highs and rising lows separated by at least one ATR, the Up / Down breakout labels and the last pivot price dashes. This version is published open source under the same license, for non-commercial use.
WHAT IT DOES
The script draws the pivot channel of the original indicator at several scales at once, on the same chart. A pivot that is k times larger behaves much like the same pivot on a timeframe k times larger (one 4h bar holds four 1h bars). So instead of switching timeframes, you see the small structure and the larger structures on top of each other.
Three layers are computed on the chart timeframe:
- Layer x1: pivot lookback 15 (the original setting), thin lines.
- Layer x4: pivot lookback 15 x 4 = 60, close to a timeframe four times larger (4h on a 1h chart), thicker lines.
- Layer x16: pivot lookback 15 x 16 = 240, close to a timeframe sixteen times larger, thickest lines.
The factor of each layer can be changed. For each layer, the extension length is multiplied by its factor and the minimum distance between two pivots (ATR 200) is multiplied by the square root of the factor, because the range of a bar grows roughly with the square root of its duration.
WHAT IS NEW COMPARED WITH THE ORIGINAL
- Multi-scale layers: up to three pivot channels of different sizes drawn together, each with its own width, transparency and labels.
- One Up / Down label per layer: the labels of the small layer no longer erase the labels of the larger layers. The labels of the larger layers read "Up x4", "Down x16" and so on.
- Latest lines extended in any direction: the original only extends falling highs and rising lows. A new setting also extends the N latest lines of each side, whatever their direction (1 = latest lines only, 0 = off, a large number = all lines). These extra extensions draw no Up / Down label, so the breakout signals still follow the original rule.
- Long extensions: TradingView cannot draw more than 500 bars into the future. Extensions longer than that are drawn up to the limit and lengthened bar after bar, so large layers and long extensions work without errors.
- Optional pivot dots (hidden by default) and separate colors for highs and lows.
HOW TO USE IT
- The thick lines of the larger layers show the main structure: rising lows act as support, falling highs as resistance.
- The thin lines of the x1 layer show the current swings inside that structure.
- Places where lines of several layers meet are the zones where the structures of several scales agree.
- An Up label means a close above an extended falling high line, a Down label means a close below an extended rising low line, on the layer named in the label.
SETTINGS
Base settings: pivot lookback of the x1 layer, extension length of the x1 layer (other layers multiply it), extension line style, pivot high and low colors, pivot dots, number of latest lines extended in any direction.
Layer x1 / x4 / x16: show the layer, factor (x4 and x16), line width, transparency, Up and Down labels.
Last pivot price: horizontal dashes and price labels on the latest high and low pivots of the x1 layer.
LIMITS
- Pivots are confirmed late and drawn in the past: a pivot appears only after its lookback has passed, 15 bars later on the x1 layer, 60 bars on x4 and 240 bars on x16. The lines and labels on the past part of the chart were not visible in real time at the place where they are drawn.
- The larger layers are an approximation of higher timeframes built on the chart timeframe; they are not the exact pivots of those timeframes and the script does not request other timeframes.
- The larger the layer, the fewer the pivots and the fewer the Up / Down labels; on a short history the x16 layer can show very few lines.
- The Up / Down labels are visual breakout marks, not a trading system. No performance is claimed. Use them with your own analysis and risk management.
- TradingView keeps at most 500 lines and 500 labels per script: on long histories the oldest drawings are removed.
릴리즈 노트
Update - new display settings:- Up and Down labels: separate options for each layer (x1, x4, x16). Each layer keeps its own last Up label and its own last Down label.
- Last pivot price: the dashes and price labels of the latest high and low pivots are now available on every layer, with one option per layer (x1 on by default, x4 and x16 off). The label shows the layer, for example "80540.2 x4".
- Pivot dots: new "Pivot dots" group with a separate transparency for high dots (70 by default) and low dots (80 by default), and a dot size setting (Auto = larger on larger layers, or a fixed size from Tiny to Huge). Dots stay hidden by default.
- Short title changed to "Titpaud CTL".
릴리즈 노트
Update - Up and Down labels:- New "Up and Down labels" group at the top of the settings, with the Up and Down options of each layer (x1, x4, x16) side by side.
- Keep all labels (on by default): every Up and Down label now stays on the chart, so past breakouts remain visible. Turn it off to keep only the last Up and the last Down label of each layer. TradingView keeps the latest 500 labels of a script.
- Label colors: Up labels are green and Down labels are red by default, with a color setting for each.
- The Up and Down labels of the x16 layer are now on by default.
- Last pivot price is now off by default on every layer (it can still be turned on per layer).
릴리즈 노트
Update (v9):- New "Pivot source" option: pivots on the candle wicks (high / low, default) or on the candle bodies (highest and lowest of open and close), so the lines can ignore the wicks.
- New fourth layer x64 (pivots and extension 64 times larger, close to a TF 64 times larger), with the same settings as the other layers: show, factor, line width, transparency, Up / Down labels and last pivot price.
- Up and Down labels are softer by default: green at 50 % opacity, red at 60 % opacity.
- Default trendline extension length (x1 layer) raised from 140 to 300 bars.
- Pivot dots shown by default.
- Each Up / Down label checkbox now has its own line in the settings.
- Short title shortened to "TitpaudCTL" (TradingView limit of 10 characters).
Note: to see the new defaults on a chart that already uses the script, remove and re-add it, or use "Reset settings".
릴리즈 노트
Update (v10): respected touches and alerts- New "Respected touches" section (one option per layer): every touch of a line is counted, on the line itself and on its dotted extension. A small number is written on the line at each touch (3, 4, 5...; the two pivots of the line are touches 1 and 2).
- Touch from above (the candle body stays above the line, the low reaches it) = green number: the line acted as support. Touch from below = red number: the line acted as resistance. Bars touching in a row on the same side count as one touch.
- "Count after break" (on by default): the extension keeps counting after a close beyond the line, so a broken resistance retested from above shows green numbers. Off: the count stops at the first close beyond the line.
- Adjustable touch tolerance (in ATR of the layer), first number shown, colors, and optional tiny diamonds on each touch (off by default).
- New "Alerts" section (one option per layer). Conditions available in the alert window: "Most touched line touched" (the line with the most touches, or the K most touched lines, or any line with at least N touches), "Next support touched", "Next resistance touched", "Any line alert", plus "Any alert() function call" for a detailed message (layer, touch number, side, price). Alerts trigger at the bar close.
- Optional "Ext Up / Ext Down" labels when the close crosses an extra extension (the lines drawn by "Latest lines extended in any direction"), off by default.
- The script now deletes its oldest lines itself, together with their touch numbers, before TradingView's 500 lines limit, so no number is left on a line that is no longer drawn.
Note: to see the new defaults, remove and re-add the indicator or use "Reset settings". Existing alerts keep the settings they were created with: create them again after changing settings.

면책사항
해당 정보와 게시물은 금융, 투자, 트레이딩 또는 기타 유형의 조언이나 권장 사항으로 간주되지 않으며, 트레이딩뷰에서 제공하거나 보증하는 것이 아닙니다. 자세한 내용은 이용 약관을 참조하세요.
면책사항
해당 정보와 게시물은 금융, 투자, 트레이딩 또는 기타 유형의 조언이나 권장 사항으로 간주되지 않으며, 트레이딩뷰에서 제공하거나 보증하는 것이 아닙니다. 자세한 내용은 이용 약관을 참조하세요.