Swing Atlas 369 | MTF Volume & Fib
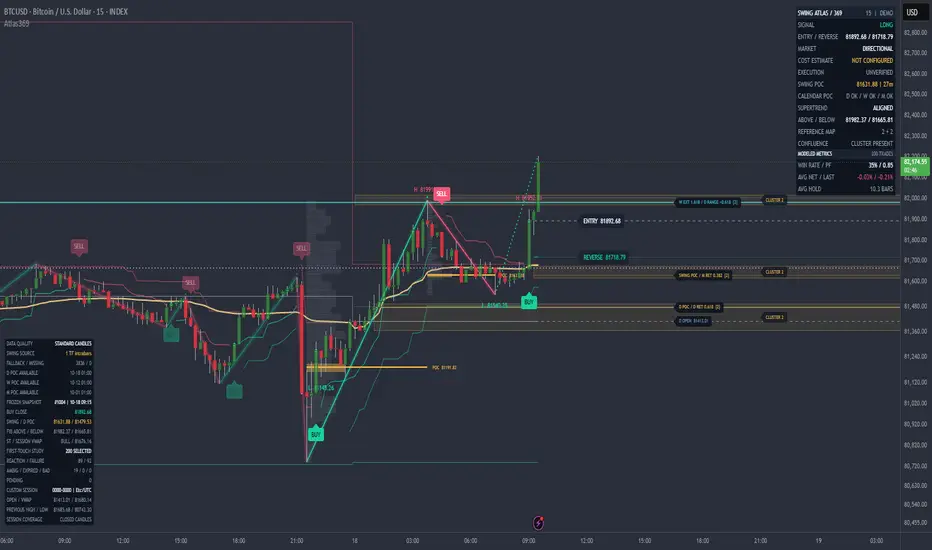
Swing Atlas 369 — Adaptive Structure, Volume & Multi-Timeframe Context
Swing Atlas 369 combines adaptive swing detection, volume-profile analysis and daily, weekly and monthly reference levels in one chart overlay. Developed to helps traders study confirmed changes in direction, understand where volume accumulated and organize potential areas of price reaction.
What the indicator does
Adaptive swing structure and reversal signals
The swing engine combines a Jurik-style smoother with volatility-based reversal thresholds. Confirmed BUY and SELL signals alternate at candle close. Sensitivity controls let users balance faster reactions against wider swings and fewer reversals.
Swing extremes and signal confirmations serve different purposes: an extreme identifies the historical turning area, while the signal marks when the reversal conditions became confirmed. The indicator does not identify exact tops or bottoms in advance.
Swing volume profiles and POC
Completed swings can display an estimated volume distribution and its Point of Control—the price bin containing the greatest allocated volume. Lower-timeframe sampling improves detail when available. Profile calculations remain estimates based on candle data, rather than exchange-level trade-by-trade volume.
Daily, weekly and monthly context
Separate calendar profiles provide completed-period POCs. The reference map also includes:
- Fibonacci retracements and extensions derived from completed candle bodies.
- Range projections anchored to the current period’s open.
- Nearby reference levels above and below price.
- Zones where references from different families overlap.
These levels describe hypothetical reaction areas; they are not guaranteed destinations.
Supertrend and session analysis
Supertrend provides an additional trend reference. Session tools include VWAP, the session open and previous-session highs and lows, with configurable session times and timezone.
Research and transparency
Optional research panels record signal snapshots and study first-touch reactions around selected POC and retracement levels. Results can be filtered by reference source and approach direction.
The indicator also provides modeled reversal statistics, data-quality information, POC age and signal audit values. These help users examine behavior and identify limitations in the underlying data.
How to use it
1. Start with Minimal mode for a clean chart.
2. Choose swing sensitivity for your instrument and timeframe.
3. Evaluate confirmed reversal signals alongside nearby POCs, higher-timeframe levels and session context.
4. Use Analysis mode to inspect diagnostics and research results.
5. Configure alerts for confirmed signals and evaluate the behavior in a demo environment before relying on it.
The indicator can be studied on intraday charts, including 3-, 6- and 15-minute intervals. No single configuration is optimal for every market or timeframe.
Display modes
- Minimal: compact information with reduced chart clutter.
- Analysis: expanded context, diagnostics and research panels.
- Publication: chart-focused presentation with dashboards hidden.
Display presets change presentation, not the underlying signal rules. Settings are organized by function and include explanatory tooltips.
Timing and realistic expectations
Reversal signals confirm at candle close. Developing visuals can change before confirmation, and historical swing extremes are identified retrospectively. Completed higher-timeframe references become available only after the required period and source-data confirmation.
Faster settings generally increase sensitivity and false reversals. Wider settings can reduce noise while delaying confirmation. Combining several references does not establish a statistical trading advantage by itself.
Historical calculations depend on the available chart history, data feed and sampling coverage. Modeled statistics and reaction counts are research tools—not broker-verified returns or proof of future profitability.
Swing Atlas 369 is an indicator, not a strategy or an order-execution system. Alerts do not independently place, close or verify broker orders. It does not provide guaranteed entries, exits or protection against losses.
What makes Swing Atlas 369 distinctive?
Swing Atlas 369 brings price structure, volume concentration and higher-timeframe reference levels into a shared analytical framework. Its distinctive feature is how these components interact: a confirmed reversal can be examined alongside the volume distribution of the completed swing, daily/weekly/monthly context and subsequent price reactions.
Individual components such as ZigZag, Supertrend, Fibonacci levels and volume profiles are established techniques. Swing Atlas’s contribution is their integration, presentation and supporting research tools—not a claim that these underlying concepts are new.
Why combine swings with volume profiles?
A swing line shows where price travelled. A swing volume profile adds an estimate of where trading activity accumulated during that movement.
Two swings can cover a similar distance while distributing volume very differently. One may concentrate activity near its origin; another may concentrate it near its final prices. Viewing that distribution alongside the completed swing provides context that a reversal marker alone cannot offer.
The swing POC identifies the profile’s highest-volume price bin. Traders can observe whether price subsequently trades above it, below it or repeatedly returns to it. The indicator displays POC age and identifies when a previous valid profile has been retained, helping users distinguish fresh information from older references.
Why include daily, weekly and monthly levels?
A short-term reversal can occur close to a broader reference area. The daily, weekly and monthly modules help place that reversal in context.
For example, a confirmed BUY signal with a nearby weekly reference above it presents a different chart situation from one with more distance to the next displayed level. This does not automatically validate or invalidate the signal; it helps traders assess location, available distance and potential obstacles.
Fibonacci extensions and range projections provide consistent, formula-based reference prices. Their usefulness comes from making scenarios explicit and repeatable—not from predicting where price must go.
Why show overlapping reference zones?
When references from different families sit near one another, showing every line separately can make the chart difficult to interpret. Swing Atlas groups nearby references into zones and retains their source information.
This makes it easier to identify areas worth observing. However, several overlapping levels are not necessarily independent evidence, and a cluster should not be interpreted as a measured probability of success.
Why use an adaptive reversal threshold?
Market volatility changes. A fixed price-distance threshold can behave very differently during quiet and active periods.
Swing Atlas uses volatility-based thresholds to adjust the distance required for a reversal. Its controls allow users to balance:
- Responsiveness: detecting changes earlier, with greater sensitivity to noise.
- Selectivity: requiring a larger movement, with later confirmation.
- Holding duration: allowing broader swings to develop before an opposing signal confirms.
The purpose is to make that trade-off manageable and visible. No setting can simultaneously eliminate delay and false signals.
What makes the research tools useful?
A chart can look convincing in hindsight. Swing Atlas includes tools designed to make its behavior easier to examine:
- Signal snapshots preserve selected reference values at confirmation.
- First-touch research records defined reactions around selected levels.
- Source and approach filters separate results by level family and the side from which price approached.
- Ambiguous and expired outcomes remain visible rather than being forced into favorable classifications.
- Data-quality diagnostics identify sampling limitations and fallback conditions.
These tools support more disciplined observation. Their results remain dependent on the selected rules, available history and data quality; they are not a substitute for independent testing.
How can it support a trading decision?
Swing Atlas organizes several practical questions around each setup:
| Question | Relevant feature |
|---|---|
| Has a directional change confirmed? | Candle-close reversal signal |
| Where did activity concentrate in the completed swing? | Swing profile and POC |
| Which broader references are nearby? | Daily, weekly and monthly map |
| How does the move relate to the current session? | Session VWAP and reference levels |
| What trend context is visible? | Supertrend |
| How have selected level touches behaved under defined rules? | Reaction research |
| Is the displayed information fresh and sufficiently sampled? | POC age and quality diagnostics |
Its practical value is a consistent process for evaluating a setup, with clearer information about timing, location and data limitations.
Swing Atlas does not promise exact turning points or profitable trades. It provides a structured way to study confirmed changes, develop hypothetical scenarios and evaluate whether the information is useful for a particular market and trading approach.
Swing Atlas 369 combines adaptive swing detection, volume-profile analysis and daily, weekly and monthly reference levels in one chart overlay. Developed to helps traders study confirmed changes in direction, understand where volume accumulated and organize potential areas of price reaction.
What the indicator does
Adaptive swing structure and reversal signals
The swing engine combines a Jurik-style smoother with volatility-based reversal thresholds. Confirmed BUY and SELL signals alternate at candle close. Sensitivity controls let users balance faster reactions against wider swings and fewer reversals.
Swing extremes and signal confirmations serve different purposes: an extreme identifies the historical turning area, while the signal marks when the reversal conditions became confirmed. The indicator does not identify exact tops or bottoms in advance.
Swing volume profiles and POC
Completed swings can display an estimated volume distribution and its Point of Control—the price bin containing the greatest allocated volume. Lower-timeframe sampling improves detail when available. Profile calculations remain estimates based on candle data, rather than exchange-level trade-by-trade volume.
Daily, weekly and monthly context
Separate calendar profiles provide completed-period POCs. The reference map also includes:
- Fibonacci retracements and extensions derived from completed candle bodies.
- Range projections anchored to the current period’s open.
- Nearby reference levels above and below price.
- Zones where references from different families overlap.
These levels describe hypothetical reaction areas; they are not guaranteed destinations.
Supertrend and session analysis
Supertrend provides an additional trend reference. Session tools include VWAP, the session open and previous-session highs and lows, with configurable session times and timezone.
Research and transparency
Optional research panels record signal snapshots and study first-touch reactions around selected POC and retracement levels. Results can be filtered by reference source and approach direction.
The indicator also provides modeled reversal statistics, data-quality information, POC age and signal audit values. These help users examine behavior and identify limitations in the underlying data.
How to use it
1. Start with Minimal mode for a clean chart.
2. Choose swing sensitivity for your instrument and timeframe.
3. Evaluate confirmed reversal signals alongside nearby POCs, higher-timeframe levels and session context.
4. Use Analysis mode to inspect diagnostics and research results.
5. Configure alerts for confirmed signals and evaluate the behavior in a demo environment before relying on it.
The indicator can be studied on intraday charts, including 3-, 6- and 15-minute intervals. No single configuration is optimal for every market or timeframe.
Display modes
- Minimal: compact information with reduced chart clutter.
- Analysis: expanded context, diagnostics and research panels.
- Publication: chart-focused presentation with dashboards hidden.
Display presets change presentation, not the underlying signal rules. Settings are organized by function and include explanatory tooltips.
Timing and realistic expectations
Reversal signals confirm at candle close. Developing visuals can change before confirmation, and historical swing extremes are identified retrospectively. Completed higher-timeframe references become available only after the required period and source-data confirmation.
Faster settings generally increase sensitivity and false reversals. Wider settings can reduce noise while delaying confirmation. Combining several references does not establish a statistical trading advantage by itself.
Historical calculations depend on the available chart history, data feed and sampling coverage. Modeled statistics and reaction counts are research tools—not broker-verified returns or proof of future profitability.
Swing Atlas 369 is an indicator, not a strategy or an order-execution system. Alerts do not independently place, close or verify broker orders. It does not provide guaranteed entries, exits or protection against losses.
What makes Swing Atlas 369 distinctive?
Swing Atlas 369 brings price structure, volume concentration and higher-timeframe reference levels into a shared analytical framework. Its distinctive feature is how these components interact: a confirmed reversal can be examined alongside the volume distribution of the completed swing, daily/weekly/monthly context and subsequent price reactions.
Individual components such as ZigZag, Supertrend, Fibonacci levels and volume profiles are established techniques. Swing Atlas’s contribution is their integration, presentation and supporting research tools—not a claim that these underlying concepts are new.
Why combine swings with volume profiles?
A swing line shows where price travelled. A swing volume profile adds an estimate of where trading activity accumulated during that movement.
Two swings can cover a similar distance while distributing volume very differently. One may concentrate activity near its origin; another may concentrate it near its final prices. Viewing that distribution alongside the completed swing provides context that a reversal marker alone cannot offer.
The swing POC identifies the profile’s highest-volume price bin. Traders can observe whether price subsequently trades above it, below it or repeatedly returns to it. The indicator displays POC age and identifies when a previous valid profile has been retained, helping users distinguish fresh information from older references.
Why include daily, weekly and monthly levels?
A short-term reversal can occur close to a broader reference area. The daily, weekly and monthly modules help place that reversal in context.
For example, a confirmed BUY signal with a nearby weekly reference above it presents a different chart situation from one with more distance to the next displayed level. This does not automatically validate or invalidate the signal; it helps traders assess location, available distance and potential obstacles.
Fibonacci extensions and range projections provide consistent, formula-based reference prices. Their usefulness comes from making scenarios explicit and repeatable—not from predicting where price must go.
Why show overlapping reference zones?
When references from different families sit near one another, showing every line separately can make the chart difficult to interpret. Swing Atlas groups nearby references into zones and retains their source information.
This makes it easier to identify areas worth observing. However, several overlapping levels are not necessarily independent evidence, and a cluster should not be interpreted as a measured probability of success.
Why use an adaptive reversal threshold?
Market volatility changes. A fixed price-distance threshold can behave very differently during quiet and active periods.
Swing Atlas uses volatility-based thresholds to adjust the distance required for a reversal. Its controls allow users to balance:
- Responsiveness: detecting changes earlier, with greater sensitivity to noise.
- Selectivity: requiring a larger movement, with later confirmation.
- Holding duration: allowing broader swings to develop before an opposing signal confirms.
The purpose is to make that trade-off manageable and visible. No setting can simultaneously eliminate delay and false signals.
What makes the research tools useful?
A chart can look convincing in hindsight. Swing Atlas includes tools designed to make its behavior easier to examine:
- Signal snapshots preserve selected reference values at confirmation.
- First-touch research records defined reactions around selected levels.
- Source and approach filters separate results by level family and the side from which price approached.
- Ambiguous and expired outcomes remain visible rather than being forced into favorable classifications.
- Data-quality diagnostics identify sampling limitations and fallback conditions.
These tools support more disciplined observation. Their results remain dependent on the selected rules, available history and data quality; they are not a substitute for independent testing.
How can it support a trading decision?
Swing Atlas organizes several practical questions around each setup:
| Question | Relevant feature |
|---|---|
| Has a directional change confirmed? | Candle-close reversal signal |
| Where did activity concentrate in the completed swing? | Swing profile and POC |
| Which broader references are nearby? | Daily, weekly and monthly map |
| How does the move relate to the current session? | Session VWAP and reference levels |
| What trend context is visible? | Supertrend |
| How have selected level touches behaved under defined rules? | Reaction research |
| Is the displayed information fresh and sufficiently sampled? | POC age and quality diagnostics |
Its practical value is a consistent process for evaluating a setup, with clearer information about timing, location and data limitations.
Swing Atlas does not promise exact turning points or profitable trades. It provides a structured way to study confirmed changes, develop hypothetical scenarios and evaluate whether the information is useful for a particular market and trading approach.

면책사항
해당 정보와 게시물은 금융, 투자, 트레이딩 또는 기타 유형의 조언이나 권장 사항으로 간주되지 않으며, 트레이딩뷰에서 제공하거나 보증하는 것이 아닙니다. 자세한 내용은 이용 약관을 참조하세요.
면책사항
해당 정보와 게시물은 금융, 투자, 트레이딩 또는 기타 유형의 조언이나 권장 사항으로 간주되지 않으며, 트레이딩뷰에서 제공하거나 보증하는 것이 아닙니다. 자세한 내용은 이용 약관을 참조하세요.