업데이트됨
SAR Trend Line Breaks Graded and Regime-Gated
SAR Trend-Line Breaks — Graded, Regime-Gated, Edge-Measured
Most SAR tools just flip a dot. This one treats the Parabolic SAR as a moving TREND LINE and studies the moment price closes through it — the SAR flip, or "break." Three layers sit on top of the raw flip, and each is meant to answer an honest question rather than decorate the chart.
1 — THE BREAK IS GRADED 0–5.
A flip on a limp doji is not the same event as a flip on a wide, high-volume thrust. On the breaking bar the script scores five independent, transparent points, one each for: displacement more than 0.25 ATR past the SAR; close in the top (or bottom) 40% of the bar; volume above 1.3x its 20-bar average; bar range above 1.5x ATR; and the candle closing in the break's direction. 0 is a limp flip, 5 is a decisive thrust. Nothing is hidden — you can read the grade off the bar yourself.
2 — BREAKS ARE REGIME-GATED.
A SAR flip is a trend trigger, and trend triggers bleed in chop. A break only ARMS when the market is actually trending, by your choice of filter: higher-timeframe alignment (require N of 9 timeframes to agree with the break's direction), a Kaufman efficiency ratio above a threshold, both, or off. Flips that fire out of regime are shown faint as context, not traded, so you can see what the filter is removing.
3 — THE EDGE IS MEASURED, NOT ASSERTED.
This is the part that makes it more than a prettier SAR. Every armed break is forward-resolved on past, closed bars under an exit model you choose (a trailing chandelier-ATR ride, a fixed +/-R barrier, a time exit, or an external line). The result is tallied per grade bucket as a win-rate with a Wilson lower bound (an honest small-sample floor, not a flattering raw percentage) and an average net R after costs, shown beside two baselines:
- A RANDOM-DIRECTION NULL — the same bars and the same exit, but a coin-flip direction. If a grade bucket does not beat the null, its "edge" is just drift and payoff geometry, not the signal.
- A FADE — the opposite direction. If fading earns more than taking, the signal is better inverted.
A grade bucket only earns your trust when it clears the null AND clears zero after costs. Small samples are greyed out as unproven. The point is to let the instrument tell you which grades are worth trading on THIS symbol and timeframe, rather than taking it on faith.
HOW TO USE
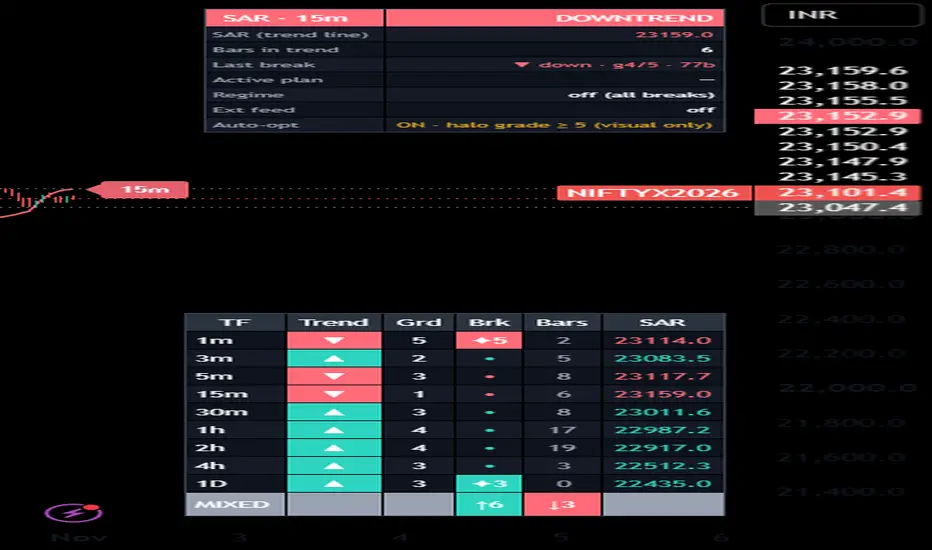
Add it to a chart. Pick the calculation timeframe (default follows your chart). Keep the breaks that pass both the strength filter and the regime gate — these are the armed markers. Open the measured-edge table (research toggle) and read the grade buckets against the NULL row before you lean on any grade; switch the exit model and watch which one turns the entry edge into a positive net R. The trade plan draws a dynamic entry / stop / target (stop trails the SAR or a chandelier-ATR; targets are R- or ATR-based). A nine-timeframe alignment table shows trend state, fresh breaks and each timeframe's SAR level at a glance.
Defaults are tuned for index / index-futures (regime gate on HTF alignment, edge validation on), but every input is adjustable — turn the gate off or switch to the efficiency ratio, retune, and re-measure on equities, FX, crypto or commodities. The measured-edge table is how you re-tune honestly: change a setting, watch the net-R-vs-null move.
OPTIONAL EXTERNAL FEED
There's an input to wire in another indicator's stop line (any plotted stop level — the field is a generic source, inactive until you point it at something). When wired it can act as the live trade stop, as an "external line" exit model in the edge table, or as a directional bias. Entirely optional; left alone, the script is standalone SAR.
PUBLISHED OUTPUTS
For users who build multi-indicator setups, the script publishes EXP_* values to the data window (SAR level, direction, graded break, stop, HTF alignment count, efficiency ratio, and a clean +1/0/-1 armed-break direction) so other indicators can read them via a source input.
NON-REPAINTING & HONESTY NOTES
Breaks confirm on bar CLOSE; the live bar is provisional until it closes. Higher-timeframe values are pulled from closed bars only, with no look-ahead. The measured-edge statistics are built solely from past, resolved events and accumulate as the chart runs — they are guidance that grows with sample, not a backtest report or a performance promise. The smoothed "paintbrush" ribbon is cosmetic and lags the raw SAR; every signal and the stop run on the raw SAR, never the ribbon.
CONCEPTS USED (operationalised here, not third-party code): Parabolic SAR and ATR (Welles Wilder), the Chandelier exit (Chuck LeBeau), the efficiency ratio (Perry Kaufman), triple-barrier labelling (in the spirit of Marcos Lopez de Prado), and the Wilson score interval (E. B. Wilson). The grading scheme, the regime gate, the nine-timeframe tally, the ribbon and the per-grade edge measurement are this script's own synthesis.
DISCLAIMER
Research and education only. This is not financial advice, not a recommendation, and not a guarantee of any outcome. Markets involve risk of loss; test anything before trading it.
Most SAR tools just flip a dot. This one treats the Parabolic SAR as a moving TREND LINE and studies the moment price closes through it — the SAR flip, or "break." Three layers sit on top of the raw flip, and each is meant to answer an honest question rather than decorate the chart.
1 — THE BREAK IS GRADED 0–5.
A flip on a limp doji is not the same event as a flip on a wide, high-volume thrust. On the breaking bar the script scores five independent, transparent points, one each for: displacement more than 0.25 ATR past the SAR; close in the top (or bottom) 40% of the bar; volume above 1.3x its 20-bar average; bar range above 1.5x ATR; and the candle closing in the break's direction. 0 is a limp flip, 5 is a decisive thrust. Nothing is hidden — you can read the grade off the bar yourself.
2 — BREAKS ARE REGIME-GATED.
A SAR flip is a trend trigger, and trend triggers bleed in chop. A break only ARMS when the market is actually trending, by your choice of filter: higher-timeframe alignment (require N of 9 timeframes to agree with the break's direction), a Kaufman efficiency ratio above a threshold, both, or off. Flips that fire out of regime are shown faint as context, not traded, so you can see what the filter is removing.
3 — THE EDGE IS MEASURED, NOT ASSERTED.
This is the part that makes it more than a prettier SAR. Every armed break is forward-resolved on past, closed bars under an exit model you choose (a trailing chandelier-ATR ride, a fixed +/-R barrier, a time exit, or an external line). The result is tallied per grade bucket as a win-rate with a Wilson lower bound (an honest small-sample floor, not a flattering raw percentage) and an average net R after costs, shown beside two baselines:
- A RANDOM-DIRECTION NULL — the same bars and the same exit, but a coin-flip direction. If a grade bucket does not beat the null, its "edge" is just drift and payoff geometry, not the signal.
- A FADE — the opposite direction. If fading earns more than taking, the signal is better inverted.
A grade bucket only earns your trust when it clears the null AND clears zero after costs. Small samples are greyed out as unproven. The point is to let the instrument tell you which grades are worth trading on THIS symbol and timeframe, rather than taking it on faith.
HOW TO USE
Add it to a chart. Pick the calculation timeframe (default follows your chart). Keep the breaks that pass both the strength filter and the regime gate — these are the armed markers. Open the measured-edge table (research toggle) and read the grade buckets against the NULL row before you lean on any grade; switch the exit model and watch which one turns the entry edge into a positive net R. The trade plan draws a dynamic entry / stop / target (stop trails the SAR or a chandelier-ATR; targets are R- or ATR-based). A nine-timeframe alignment table shows trend state, fresh breaks and each timeframe's SAR level at a glance.
Defaults are tuned for index / index-futures (regime gate on HTF alignment, edge validation on), but every input is adjustable — turn the gate off or switch to the efficiency ratio, retune, and re-measure on equities, FX, crypto or commodities. The measured-edge table is how you re-tune honestly: change a setting, watch the net-R-vs-null move.
OPTIONAL EXTERNAL FEED
There's an input to wire in another indicator's stop line (any plotted stop level — the field is a generic source, inactive until you point it at something). When wired it can act as the live trade stop, as an "external line" exit model in the edge table, or as a directional bias. Entirely optional; left alone, the script is standalone SAR.
PUBLISHED OUTPUTS
For users who build multi-indicator setups, the script publishes EXP_* values to the data window (SAR level, direction, graded break, stop, HTF alignment count, efficiency ratio, and a clean +1/0/-1 armed-break direction) so other indicators can read them via a source input.
NON-REPAINTING & HONESTY NOTES
Breaks confirm on bar CLOSE; the live bar is provisional until it closes. Higher-timeframe values are pulled from closed bars only, with no look-ahead. The measured-edge statistics are built solely from past, resolved events and accumulate as the chart runs — they are guidance that grows with sample, not a backtest report or a performance promise. The smoothed "paintbrush" ribbon is cosmetic and lags the raw SAR; every signal and the stop run on the raw SAR, never the ribbon.
CONCEPTS USED (operationalised here, not third-party code): Parabolic SAR and ATR (Welles Wilder), the Chandelier exit (Chuck LeBeau), the efficiency ratio (Perry Kaufman), triple-barrier labelling (in the spirit of Marcos Lopez de Prado), and the Wilson score interval (E. B. Wilson). The grading scheme, the regime gate, the nine-timeframe tally, the ribbon and the per-grade edge measurement are this script's own synthesis.
DISCLAIMER
Research and education only. This is not financial advice, not a recommendation, and not a guarantee of any outcome. Markets involve risk of loss; test anything before trading it.
릴리즈 노트
MTF feature added for ease of visual refer
면책사항
해당 정보와 게시물은 금융, 투자, 트레이딩 또는 기타 유형의 조언이나 권장 사항으로 간주되지 않으며, 트레이딩뷰에서 제공하거나 보증하는 것이 아닙니다. 자세한 내용은 이용 약관을 참조하세요.
면책사항
해당 정보와 게시물은 금융, 투자, 트레이딩 또는 기타 유형의 조언이나 권장 사항으로 간주되지 않으며, 트레이딩뷰에서 제공하거나 보증하는 것이 아닙니다. 자세한 내용은 이용 약관을 참조하세요.