PROTECTED SOURCE SCRIPT
업데이트됨 Argentina Bonds Yield Curve
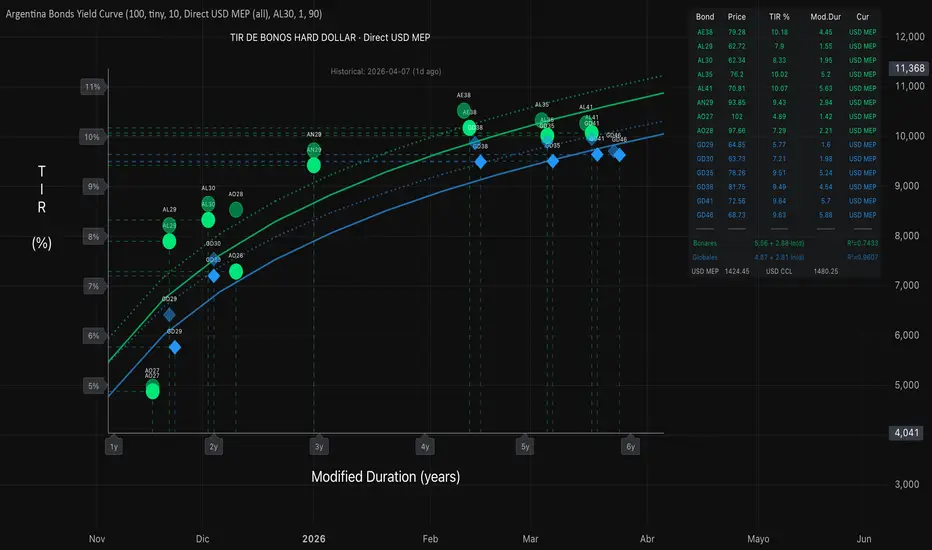
ARGENTINA SOVEREIGN BONDS - YIELD CURVE
This indicator plots the yield curve for Argentine sovereign bonds, showing the relationship between yield (TIR/IRR) and Modified Duration for both Bonares (Argentine law) and Globales (NY law) bond families.
BONDS INCLUDED:
• Bonares: AE38, AL29, AL30, AL35, AL41, AN29, AO27
• Globales: GD29, GD30, GD35, GD38, GD41, GD46
FEATURES:
• Scatter plot with TIR (%) on Y-axis and Modified Duration (years) on X-axis
• Separate logarithmic regression curves: TIR = a + b × ln(Duration)
• R² goodness-of-fit displayed for each curve
• Info table with prices, TIR, Modified Duration, and currency for all 13 bonds
• Prices converted to USD MEP (Bonares) and USD Cable/CCL (Globales) via AL30/AL30D/AL30C ratios
• Hover over any data point to see TIR and Modified Duration details
• AO27 price configurable manually (not yet listed on BCBA)
METHODOLOGY:
• Day count convention: Actual/365
• Settlement: T+1
• IRR: Newton-Raphson iterative method (50 iterations, tolerance 1e-6)
• Modified Duration = Macaulay Duration / (1 + TIR)
• Currency conversion: Bonares prices × (AL30D/AL30) = USD MEP; Globales prices × (AL30C/AL30) = USD CCL
HOW TO READ THE CHART:
• Points further LEFT have shorter duration (less interest rate sensitivity)
• Points further RIGHT have longer duration (more interest rate sensitivity)
• Points further UP offer higher yield
• The regression curve shows the "fair value" yield for a given duration — points ABOVE the curve are cheap relative to peers, points BELOW are rich
• Bonares (circles, blue) and Globales (diamonds, teal) form separate curves due to different legal jurisdictions
NOTE: AO27 is shown in purple as it is not yet listed on BCBA. Its price must be entered manually in the indicator settings.
DISCLAIMER:
This indicator is for informational and educational purposes only. Eco Valores S.A. does NOT provide investment advice or recommendations. Consult a qualified financial advisor before making investment decisions.
————————————————————————————
ES: Curva de rendimientos para los 13 bonos soberanos argentinos en dólares, separados por familia: Bonares (ley argentina) y Globales (ley NY). Grafica TIR (%) en eje Y vs Duración Modificada (años) en eje X, con regresión logarítmica separada por familia. Precios convertidos a Dólar MEP (Bonares) y Dólar Cable/CCL (Globales) vía ratios AL30/AL30D/AL30C. Puntos por encima de la curva de regresión están baratos respecto a sus pares; puntos por debajo están caros. AO27 se muestra en violeta (no cotiza aún en BCBA, precio configurable en ajustes).
AVISO LEGAL: Este indicador es solo para fines informativos y educativos. Eco Valores S.A. NO brinda asesoramiento ni recomendaciones de inversión. Consulte con un asesor financiero calificado antes de tomar decisiones de inversión.
 AL29 AL30 AL35 AE38 AN29 AL41 GD29 GD30 GD35 GD38 GD41
This indicator plots the yield curve for Argentine sovereign bonds, showing the relationship between yield (TIR/IRR) and Modified Duration for both Bonares (Argentine law) and Globales (NY law) bond families.
BONDS INCLUDED:
• Bonares: AE38, AL29, AL30, AL35, AL41, AN29, AO27
• Globales: GD29, GD30, GD35, GD38, GD41, GD46
FEATURES:
• Scatter plot with TIR (%) on Y-axis and Modified Duration (years) on X-axis
• Separate logarithmic regression curves: TIR = a + b × ln(Duration)
• R² goodness-of-fit displayed for each curve
• Info table with prices, TIR, Modified Duration, and currency for all 13 bonds
• Prices converted to USD MEP (Bonares) and USD Cable/CCL (Globales) via AL30/AL30D/AL30C ratios
• Hover over any data point to see TIR and Modified Duration details
• AO27 price configurable manually (not yet listed on BCBA)
METHODOLOGY:
• Day count convention: Actual/365
• Settlement: T+1
• IRR: Newton-Raphson iterative method (50 iterations, tolerance 1e-6)
• Modified Duration = Macaulay Duration / (1 + TIR)
• Currency conversion: Bonares prices × (AL30D/AL30) = USD MEP; Globales prices × (AL30C/AL30) = USD CCL
HOW TO READ THE CHART:
• Points further LEFT have shorter duration (less interest rate sensitivity)
• Points further RIGHT have longer duration (more interest rate sensitivity)
• Points further UP offer higher yield
• The regression curve shows the "fair value" yield for a given duration — points ABOVE the curve are cheap relative to peers, points BELOW are rich
• Bonares (circles, blue) and Globales (diamonds, teal) form separate curves due to different legal jurisdictions
NOTE: AO27 is shown in purple as it is not yet listed on BCBA. Its price must be entered manually in the indicator settings.
DISCLAIMER:
This indicator is for informational and educational purposes only. Eco Valores S.A. does NOT provide investment advice or recommendations. Consult a qualified financial advisor before making investment decisions.
————————————————————————————
ES: Curva de rendimientos para los 13 bonos soberanos argentinos en dólares, separados por familia: Bonares (ley argentina) y Globales (ley NY). Grafica TIR (%) en eje Y vs Duración Modificada (años) en eje X, con regresión logarítmica separada por familia. Precios convertidos a Dólar MEP (Bonares) y Dólar Cable/CCL (Globales) vía ratios AL30/AL30D/AL30C. Puntos por encima de la curva de regresión están baratos respecto a sus pares; puntos por debajo están caros. AO27 se muestra en violeta (no cotiza aún en BCBA, precio configurable en ajustes).
AVISO LEGAL: Este indicador es solo para fines informativos y educativos. Eco Valores S.A. NO brinda asesoramiento ni recomendaciones de inversión. Consulte con un asesor financiero calificado antes de tomar decisiones de inversión.
AL29 AL30 AL35 AE38 AN29 AL41 GD29 GD30 GD35 GD38 GD41 릴리즈 노트
Argentina Bonds Yield CurveReal-time yield curve for 13 Argentine sovereign bonds — 7 Bonares (Argentine law) and 6 Globales (NY law).
How it works
Each bond is plotted as a scatter point with TIR (IRR) on the Y-axis and Modified Duration on the X-axis. Separate logarithmic regression curves (TIR = a + b × ln(Duration)) are fitted for each bond family.
Bonds covered
Bonares: AE38, AL29, AL30, AL35, AL41, AN29, AO27
Globales: GD29, GD30, GD35, GD38, GD41, GD46
Three pricing modes
ARS → USD (via AL30 ratios) (default): Fetches ARS prices and converts to USD using AL30D/AL30 (MEP) for Bonares and AL30C/AL30 (Cable) for Globales. This is an approximation — actual MEP/Cable ratios may differ by bond.
Direct USD (MEP + Cable): Uses direct BCBA USD quotes — suffix D (MEP) for Bonares, suffix C (Cable) for Globales.
Direct USD MEP (all): Uses BCBA suffix D (MEP) quotes for all bonds.
Cash-Flow Schedule
Optional table (off by default) showing coupon, amortization, and remaining principal for any selected bond.
Info table
Bond prices, TIR, Modified Duration, currency, regression parameters, R², and MEP/CCL exchange rates.
Methodology
Day count: Actual/365
Settlement: T+1
IRR: Newton-Raphson
Modified Duration = Macaulay Duration / (1 + TIR)
AO27 uses a manual price input and hardcoded settlement date (pre-listing)
Español
Curva de rendimientos en tiempo real para 13 bonos soberanos argentinos (7 Bonares, 6 Globales). Tres modos de pricing: conversión ARS→USD vía ratios AL30 (por defecto), cotizaciones directas MEP+Cable, o todo MEP. Incluye tabla de flujo de fondos opcional y tabla informativa con TIR, Duración Modificada, R² y tipos de cambio. Metodología: Actual/365, T+1, Newton-Raphson. AO27 con precio manual y fecha de liquidación fija (pre-listado).
릴리즈 노트
[EN] Update: Historical Yield Curve ComparisonNew feature: overlay a historical yield curve from X trading days ago on top of the current curve to visualize how the yield curve has shifted over time.
Historical regression curves (dotted) for both Bonares and Globales, drawn alongside the current solid curves
Historical scatter points for each individual bond (semi-transparent), so you can see exactly where each bond was priced X days ago
Date label showing the exact date of the historical snapshot
Optional fill between current and historical curves to highlight the spread visually
Configurable lookback period (1–250 trading days)
In ARS→USD mode, historical conversion uses the AL30/AL30D/AL30C ratios from that date — not today's rates
AO27 excluded from historical curves (manual price, no historical data)
[ES] Actualizacion: Comparacion con Curva de Rendimientos Historica
Nueva funcionalidad: superponer la curva de rendimientos de X ruedas atras sobre la curva actual para visualizar como se desplazo la curva en el tiempo.
Curvas de regresion historicas (punteadas) para Bonares y Globales, junto a las curvas solidas actuales
Puntos individuales historicos por bono (semi-transparentes), para ver exactamente donde cotizaba cada bono X ruedas atras
Etiqueta con fecha del snapshot historico
Relleno opcional entre curvas actual e historica para resaltar visualmente el spread
Periodo de retrospectiva configurable (1–250 ruedas)
En modo ARS→USD, la conversion historica usa los ratios AL30/AL30D/AL30C de esa fecha — no los de hoy
AO27 excluido de las curvas historicas (precio manual, sin datos historicos)
릴리즈 노트
[EN] Update: AO27 Live Market PriceAO27 is now trading on BYMA. This update removes the manual price input and fetches AO27's market price directly from TradingView, just like all other bonds.
AO27 now uses live BCBA quotes (ARS and USD MEP) — no more manual price entry
Standard T+1 settlement applies to AO27 (previously used a hardcoded date)
All three pricing modes work with AO27 (ARS→USD, Direct MEP+Cable, Direct MEP)
AO27 remains excluded from historical curves due to its limited trading history
[ES] Actualizacion: AO27 con Precio de Mercado en Vivo
AO27 ya cotiza en BCBA. Esta actualizacion elimina el ingreso manual de precio y toma la cotizacion de mercado directamente de TradingView, igual que el resto de los bonos.
AO27 ahora usa cotizaciones en vivo de BYMA (ARS y USD MEP) — sin mas carga manual de precio
Liquidacion estandar T+1 para AO27 (antes usaba una fecha fija)
Los tres modos de pricing funcionan con AO27 (ARS→USD, Directo MEP+Cable, Directo MEP)
AO27 sigue excluido de las curvas historicas por su historial de cotizacion limitado
릴리즈 노트
Argentina Sovereign Bonds — Yield CurveThis indicator plots a real-time yield curve for Argentine sovereign bonds, showing each bond as a scatter point with TIR (IRR) on the Y-axis and Modified Duration on the X-axis. Two separate logarithmic regression curves are fitted for Bonares (Argentine law) and Globales (NY law) families.
Supported Bonds (14):
Bonares: AE38, AL29, AL30, AL35, AL41, AN29, AO27, AO28
Globales: GD29, GD30, GD35, GD38, GD41, GD46
Key Features:
Logarithmic regression: TIR = a + b × ln(Modified Duration), with R² displayed
Three pricing modes: ARS → USD (via AL30 ratios), Direct USD (MEP + Cable), Direct USD MEP
Historical yield curve overlay: compare the current curve against X trading days ago
Optional fill between current and historical curves to visualize spread compression/expansion
Cash-Flow Schedule table: per-bond breakdown of future coupons, amortizations, and remaining principal
AO28 plotted with a distinct color (purple) — currently using auction price (USD 94.20) until market data becomes available
Methodology:
Day count: Actual/365 | Settlement: T+1
IRR: Newton-Raphson iterative method (50 iterations, tolerance 1e-6)
Modified Duration = Macaulay Duration / (1 + TIR)
Currency conversion via AL30/AL30D/AL30C ratios
Curva de Rendimientos — Bonos Soberanos Argentinos
Este indicador grafica la curva de rendimientos en tiempo real para bonos soberanos argentinos. Cada bono se muestra como un punto con TIR en el eje Y y Duración Modificada en el eje X, con regresiones logarítmicas separadas para Bonares y Globales.
AO28 (nuevo — licitación marzo 2026) se muestra en color púrpura con precio de licitación USD 94.20 hasta que comience a cotizar en BCBA.
⚠️ Disclaimer / Aviso Legal
This indicator is for informational and educational purposes only. Eco Valores S.A. does NOT provide investment advice or recommendations. Consult a qualified financial advisor before making investment decisions.
Este indicador es solo para fines informativos y educativos. Eco Valores S.A. NO brinda asesoramiento ni recomendaciones de inversión.
릴리즈 노트
Argentina Sovereign Bonds — Yield CurveThis indicator plots a real-time yield curve for Argentine sovereign bonds, showing each bond as a scatter point with TIR (IRR) on the Y-axis and Modified Duration on the X-axis. Two separate logarithmic regression curves are fitted for Bonares (Argentine law) and Globales (NY law) families.
Supported Bonds (14):
Bonares: AE38, AL29, AL30, AL35, AL41, AN29, AO27, AO28
Globales: GD29, GD30, GD35, GD38, GD41, GD46
Key Features:
Logarithmic regression: TIR = a + b × ln(Modified Duration), with R² displayed
Three pricing modes: ARS → USD (via AL30 ratios), Direct USD (MEP + Cable), Direct USD MEP
Historical yield curve overlay: compare the current curve against X trading days ago
Optional fill between current and historical curves to visualize spread compression/expansion
Cash-Flow Schedule table: per-bond breakdown of future coupons, amortizations, and remaining principal
AO28 plotted with a distinct color (purple) — currently using auction price (USD 94.20) until market data becomes available
Methodology:
Day count: Actual/365 | Settlement: T+1
IRR: Newton-Raphson iterative method (50 iterations, tolerance 1e-6)
Modified Duration = Macaulay Duration / (1 + TIR)
Currency conversion via AL30/AL30D/AL30C ratios
Curva de Rendimientos — Bonos Soberanos Argentinos
Este indicador grafica la curva de rendimientos en tiempo real para bonos soberanos argentinos. Cada bono se muestra como un punto con TIR en el eje Y y Duración Modificada en el eje X, con regresiones logarítmicas separadas para Bonares y Globales.
AO28 (nuevo — licitación marzo 2026) se muestra en color púrpura con precio de licitación USD 94.20 hasta que comience a cotizar en BCBA. Precio hardcodeado
⚠️ Disclaimer / Aviso Legal
This indicator is for informational and educational purposes only. Eco Valores S.A. does NOT provide investment advice or recommendations. Consult a qualified financial advisor before making investment decisions.
Este indicador es solo para fines informativos y educativos. Eco Valores S.A. NO brinda asesoramiento ni recomendaciones de inversión.
릴리즈 노트
Descripción (ES)Indicador de curva de rendimientos para bonos soberanos argentinos. Grafica los 14 bonos hard-dollar del canje 2020 — Bonares ley argentina (AE38, AL29, AL30, AL35, AL41, AN29, AO27, AO28) y Globales ley NY (GD29, GD30, GD35, GD38, GD41, GD46) — como un scatter plot con TIR en el eje Y y Duración Modificada en el eje X, ajustando dos curvas de regresión logarítmica separadas. Calcula TIR vía Newton-Raphson sobre el cronograma de cupones y amortizaciones de cada bono. Soporta tres modos de pricing (ARS→USD vía AL30, USD MEP+CCL directo, USD MEP para todos), curva histórica superpuesta, tabla de flujo de fondos opcional, y título dinámico que indica la convención de conversión activa.
Description (EN)
Argentina Bonds Yield Curve is a yield-curve scatter plot built specifically for the 14 Argentine sovereign hard-dollar bonds issued in the 2020 sovereign debt restructuring. It plots each bond as a point with TIR (Yield to Maturity) on the Y-axis and Modified Duration on the X-axis, then fits two logarithmic regression curves — one for Bonares (Argentine-law) and one for Globales (New York-law) — so you can visually identify rich/cheap bonds, compare the slope of each legal-jurisdiction curve, and track shifts in the term structure over time.
Bonds covered:
Bonares (8): AE38, AL29, AL30, AL35, AL41, AN29, AO27, AO28
Globales (6): GD29, GD30, GD35, GD38, GD41, GD46
Methodology:
TIR calculation: Newton-Raphson iterative IRR over the full hardcoded coupon + amortization schedule of each bond, computed at T+1 settlement. Day-count convention is Actual/365.
Modified Duration: Macaulay duration discounted at the per-bond TIR, divided by (1 + TIR). The X-axis is therefore the interest-rate sensitivity, not the calendar tenor — so amortizing bonds with front-loaded principal correctly appear shorter than their nominal maturity would suggest.
Logarithmic regression: TIR = a + b · ln(Duration) fitted by least squares, separately for Bonares and Globales. The R² of each fit is available as an optional on-chart label.
Three pricing modes (selectable via input):
ARS → USD via AL30 ratios (default) — fetches ARS-denominated prices from BCBA and converts each Bonar to USD MEP through the AL30D/AL30 ratio, each Global to USD CCL through the AL30C/AL30 ratio. Best when ARS legs are more liquid than the direct USD legs.
Direct USD (MEP + Cable) — uses BCBA's direct USD quotes: D-suffix tickers (MEP) for Bonares, C-suffix (Cable) for Globales.
Direct USD MEP (all) — uses D-suffix MEP quotes for the entire universe.
The active mode is shown in a chart title above the plot, in the form "TIR DE BONOS HARD DOLLAR · …" so you always know which conversion convention is producing the displayed yields.
Additional features:
Historical curve overlay — compare today's curve against the curve from N trading days ago (configurable, default 5). Renders as dotted regression lines with semi-transparent scatter points and a dated label. AO27 and AO28 are excluded from the historical overlay due to limited trading history. Optional shaded fill between current and historical curves makes parallel shifts and twist movements visually obvious.
Cash-flow schedule table (optional) — pick any bond from a dropdown and the indicator displays the per-coupon breakdown: payment date, coupon (per 100 VNO), amortization (per 100 VNO), and remaining principal percentage after each cash flow. Useful for verifying duration calculations or checking when the next coupon hits.
Info table (top-right) showing per-bond Price, TIR, Modified Duration, and currency convention, plus the Bonares and Globales regression equations and the live USD MEP / CCL exchange rates derived from AL30/AL30D/AL30C.
Crosshair guides — each bond point is connected to both axes by dashed lines, making it easy to read off exact coordinates.
Fully customizable colors for Bonares, Globales, regression curves, historical overlay, and inter-curve fill.
Use cases: identifying relative-value opportunities along the curve, monitoring the Bonares-Globales legal-jurisdiction spread, tracking duration-adjusted yield shifts day-over-day, building cash-flow-driven strategies, and simply having a clean visual snapshot of the entire Argentine sovereign hard-dollar complex on one chart.
Disclaimer: for informational and educational purposes only. Not investment advice. Calculations assume hold-to-maturity and ignore transaction costs, taxes, withholdings, and liquidity risk. Data may be delayed or inaccurate. Consult a licensed financial advisor before trading.
AL30 AL30D AL30C AO28 AO28D AO28C GD30 GD30D GD30C 릴리즈 노트
Novedades (ES)AO27 y AO28 ahora participan en la curva histórica. Hasta ahora estos dos bonos se excluían del overlay de curva histórica porque tenían historial de cotización muy limitado en TradingView (AO27 listado en octubre 2025, AO28 en abril 2026). Con varios meses de ruedas acumuladas, ya hay suficiente historial para cualquier Trading Days Ago razonable, así que ambos se incorporaron al cálculo histórico: precios histPrcAO27 / histPrcAO28, métricas histTirAO27 / histModDAO27 y histTirAO28 / histModDAO28, y los puntos semi-transparentes correspondientes en el scatter histórico junto al resto de los Bonares. La curva de regresión logarítmica histórica de Bonares ahora ajusta sobre los 8 bonos completos en lugar de 6, mejorando la calidad del fit en el tramo corto. La docstring fue actualizada en español e inglés para reflejar que los 14 bonos del canje 2020 participan tanto en la curva actual como en la histórica.
What's new (EN)
AO27 and AO28 are now included in the historical yield curve overlay. Previously these two newer Bonares were excluded from the Show Historical Curve feature because they had very limited TradingView trading history — AO27 was first listed in October 2025 and AO28 only became live on April 1, 2026 with the auction-settlement of the new Bonar 2028. At that time, looking back even five trading days for either bond risked returning na from the request.security historical fetch, which would have polluted the dotted regression curve and the semi-transparent ghost scatter points. Several months of accumulated trading data later, both bonds now have a solid backlog of price history sufficient for any reasonable Trading Days Ago value (the indicator's input is capped at 250).
AO27 AO28 AAO27D
AO28D AL30 AL30D 보호된 스크립트입니다
이 스크립트는 비공개 소스로 게시됩니다. 하지만 이를 자유롭게 제한 없이 사용할 수 있습니다 – 자세한 내용은 여기에서 확인하세요.

Eco Valores S.A.
Agente de Liquidación y Compensación (ALyC) n° 109/CNV
Agente de Colocación y Distribución Integral de Fondos Comunes de Inversión (ACyDI FCI) n°45/CNV.
Miembro de A3 Mercados S.A., MAV S.A. y Bolsas y Mercados Argentinos S.A. (ByMA).
Agente de Liquidación y Compensación (ALyC) n° 109/CNV
Agente de Colocación y Distribución Integral de Fondos Comunes de Inversión (ACyDI FCI) n°45/CNV.
Miembro de A3 Mercados S.A., MAV S.A. y Bolsas y Mercados Argentinos S.A. (ByMA).
면책사항
해당 정보와 게시물은 금융, 투자, 트레이딩 또는 기타 유형의 조언이나 권장 사항으로 간주되지 않으며, 트레이딩뷰에서 제공하거나 보증하는 것이 아닙니다. 자세한 내용은 이용 약관을 참조하세요.
보호된 스크립트입니다
이 스크립트는 비공개 소스로 게시됩니다. 하지만 이를 자유롭게 제한 없이 사용할 수 있습니다 – 자세한 내용은 여기에서 확인하세요.
Eco Valores S.A.
Agente de Liquidación y Compensación (ALyC) n° 109/CNV
Agente de Colocación y Distribución Integral de Fondos Comunes de Inversión (ACyDI FCI) n°45/CNV.
Miembro de A3 Mercados S.A., MAV S.A. y Bolsas y Mercados Argentinos S.A. (ByMA).
Agente de Liquidación y Compensación (ALyC) n° 109/CNV
Agente de Colocación y Distribución Integral de Fondos Comunes de Inversión (ACyDI FCI) n°45/CNV.
Miembro de A3 Mercados S.A., MAV S.A. y Bolsas y Mercados Argentinos S.A. (ByMA).
면책사항
해당 정보와 게시물은 금융, 투자, 트레이딩 또는 기타 유형의 조언이나 권장 사항으로 간주되지 않으며, 트레이딩뷰에서 제공하거나 보증하는 것이 아닙니다. 자세한 내용은 이용 약관을 참조하세요.