OPEN-SOURCE SCRIPT
업데이트됨 GBR Quant Trend & Reversal
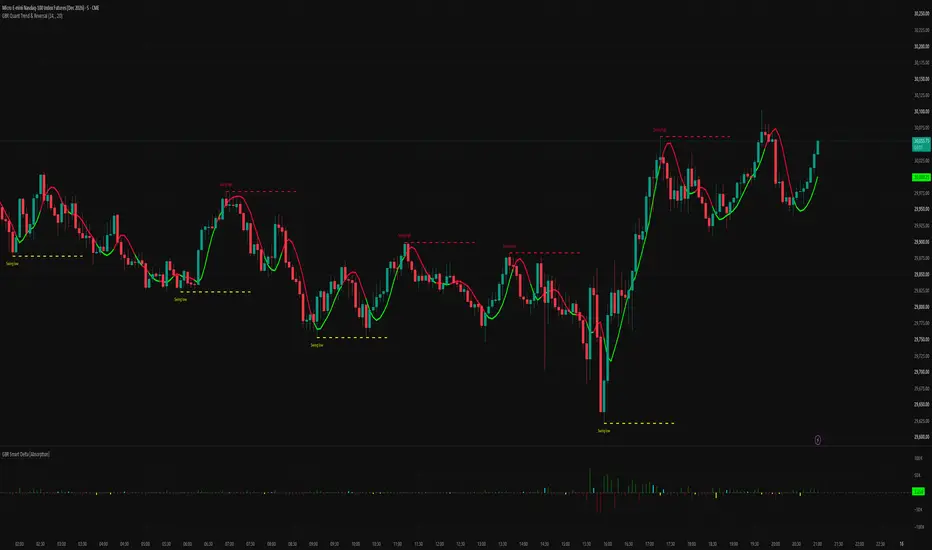
GBR Quant Trend & Reversal is a zero-noise, institutional-grade indicator built for prop firm traders and aggressive day traders. Unlike lagging kernel regressions, this dynamic ribbon is highly sensitive to real-time price action, getting you into the move earlier.
🔥 Core Features:
Dynamic Trend Ribbon: Instantly shifts between UV Green (Bullish) and UV Red (Bearish) the moment price crosses the moving average band.
Multi-Timeframe (MTF) Ready: Trade on a 5m chart while plotting a 1H or 4H trend ribbon to stay aligned with the macro order flow.
Historical Reversal Zones: Automatically plots dashed UV lines at major structural pivot highs and lows. Use these visual markers to backtest past liquidity sweeps and identify future high-probability reversal zones.
Clean UI: Stripped of unnecessary clutter. Just raw data and striking UV colors.
🔥 Core Features:
Dynamic Trend Ribbon: Instantly shifts between UV Green (Bullish) and UV Red (Bearish) the moment price crosses the moving average band.
Multi-Timeframe (MTF) Ready: Trade on a 5m chart while plotting a 1H or 4H trend ribbon to stay aligned with the macro order flow.
Historical Reversal Zones: Automatically plots dashed UV lines at major structural pivot highs and lows. Use these visual markers to backtest past liquidity sweeps and identify future high-probability reversal zones.
Clean UI: Stripped of unnecessary clutter. Just raw data and striking UV colors.
릴리즈 노트
v2.0 — Markers renamed, and an option for confirmed higher-timeframe dataTwo changes in this update. Neither alters how the script calculates
anything — the trend line and the markers appear exactly where they did
before.
1. "Reversal (Top)" and "Reversal (Bottom)" are now "Swing high" and
"Swing low".
A pivot means one thing: the high is above the N bars around it. Some of
those become reversals, others are just a pause before the move
continues. The script cannot tell the difference at the time, so calling
every one of them a reversal was claiming more than it knows. The new
labels say exactly what was found, and leave the interpretation to you.
2. New option: "Use only closed higher-timeframe bars", on by default.
When on, the trend line only updates once the higher-timeframe bar has
closed. This means the historical chart matches what you would have seen
live. When off, the line reacts sooner, but it can change within the bar,
and the historical display will look better than it actually was. Try
both and use whichever fits how you trade.
Other changes:
- Warning on the chart if the selected trend timeframe is lower than the
chart timeframe, which produces misleading results
- Alerts added: price crossing the trend line in either direction, and
confirmed swing highs and lows
- Markers and labels can now be toggled separately
- Colours are configurable
- The plot was labelled "Ribbon" but draws a single line — renamed to
"Trend line"
A note on timing that has not changed: a marker only appears after the
pivot lookback has passed. With the default of 20, that is 20 bars after
the actual high or low. This is not a delay that can be removed — without
it there would be no way to know the high was a high.
오픈 소스 스크립트
트레이딩뷰의 진정한 정신에 따라, 이 스크립트의 작성자는 이를 오픈소스로 공개하여 트레이더들이 기능을 검토하고 검증할 수 있도록 했습니다. 작성자에게 찬사를 보냅니다! 이 코드는 무료로 사용할 수 있지만, 코드를 재게시하는 경우 하우스 룰이 적용된다는 점을 기억하세요.

면책사항
해당 정보와 게시물은 금융, 투자, 트레이딩 또는 기타 유형의 조언이나 권장 사항으로 간주되지 않으며, 트레이딩뷰에서 제공하거나 보증하는 것이 아닙니다. 자세한 내용은 이용 약관을 참조하세요.
오픈 소스 스크립트
트레이딩뷰의 진정한 정신에 따라, 이 스크립트의 작성자는 이를 오픈소스로 공개하여 트레이더들이 기능을 검토하고 검증할 수 있도록 했습니다. 작성자에게 찬사를 보냅니다! 이 코드는 무료로 사용할 수 있지만, 코드를 재게시하는 경우 하우스 룰이 적용된다는 점을 기억하세요.
면책사항
해당 정보와 게시물은 금융, 투자, 트레이딩 또는 기타 유형의 조언이나 권장 사항으로 간주되지 않으며, 트레이딩뷰에서 제공하거나 보증하는 것이 아닙니다. 자세한 내용은 이용 약관을 참조하세요.