Gravity Model overlay
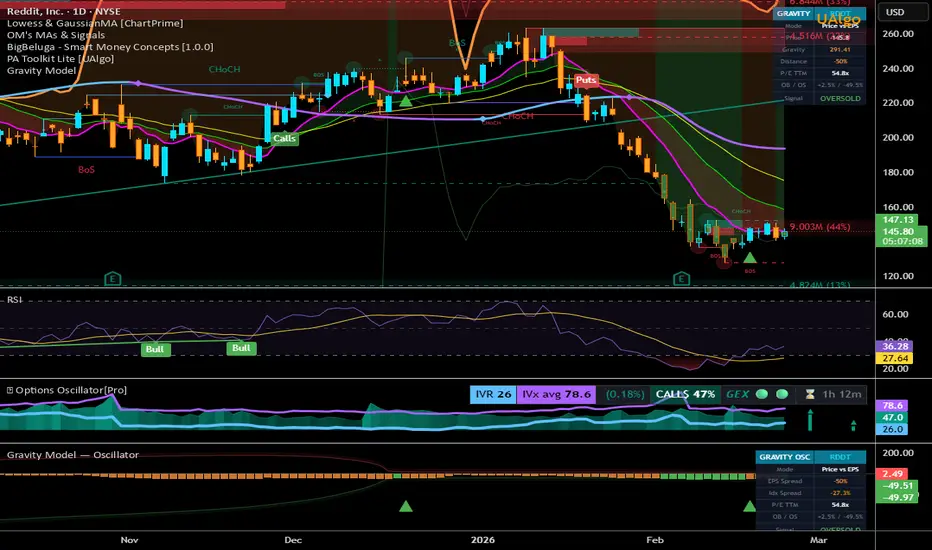
Gravity Model — Overlay
Indicator that projects a "gravity line" on chart — the fair value of price based on earnings growth rate (EPS TTM). Concept: if price perfectly tracked profit growth, it would sit on the gravity line. When it deviates significantly → mean reversion.
What it displays:
Gravity line (orange) — where price should be if it tracked earnings growth
OB/OS bands — dynamic bands based on mean ± 1.2σ of historical deviation
Fill color — cyan above gravity, orange below; intense red in OB, intense green in OS
Arrows — sell signal on OB exit, buy signal on OS exit
Info table — price, gravity, distance %, P/E, signal
3 modes: Price vs EPS, Price vs Index, Both.
Logic: gravity = price_N_bars_ago * (current_EPS / EPS_N_bars_ago), spread = % deviation from gravity. Earnings act as fundamental anchor, price oscillates around it like a pendulum.
Indicator that projects a "gravity line" on chart — the fair value of price based on earnings growth rate (EPS TTM). Concept: if price perfectly tracked profit growth, it would sit on the gravity line. When it deviates significantly → mean reversion.
What it displays:
Gravity line (orange) — where price should be if it tracked earnings growth
OB/OS bands — dynamic bands based on mean ± 1.2σ of historical deviation
Fill color — cyan above gravity, orange below; intense red in OB, intense green in OS
Arrows — sell signal on OB exit, buy signal on OS exit
Info table — price, gravity, distance %, P/E, signal
3 modes: Price vs EPS, Price vs Index, Both.
Logic: gravity = price_N_bars_ago * (current_EPS / EPS_N_bars_ago), spread = % deviation from gravity. Earnings act as fundamental anchor, price oscillates around it like a pendulum.

면책사항
해당 정보와 게시물은 금융, 투자, 트레이딩 또는 기타 유형의 조언이나 권장 사항으로 간주되지 않으며, 트레이딩뷰에서 제공하거나 보증하는 것이 아닙니다. 자세한 내용은 이용 약관을 참조하세요.
면책사항
해당 정보와 게시물은 금융, 투자, 트레이딩 또는 기타 유형의 조언이나 권장 사항으로 간주되지 않으며, 트레이딩뷰에서 제공하거나 보증하는 것이 아닙니다. 자세한 내용은 이용 약관을 참조하세요.