OPEN-SOURCE SCRIPT
Power Order Blocks [ChartPrime]
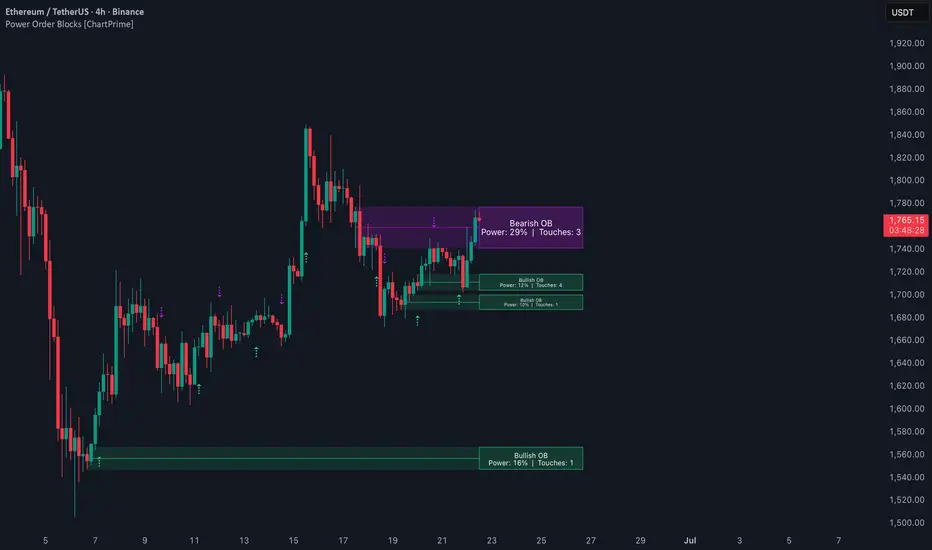
🔶 OVERVIEW
Power Order Blocks [ChartPrime] is an advanced structural detection engine designed to identify high-probability supply and demand zones. Unlike standard order block indicators, this tool focuses on "Power" — the intensity of the displacement following the block's formation, combined with a live information panel, equilibrium mapping, and touch tracking built directly into each zone.
It identifies the specific candle where institutional participants likely placed large orders, marks the resulting price inefficiency, and tracks these zones in real time until they are either mitigated or invalidated.
🔶 CORE CONCEPT — THE DISPLACEMENT VALIDATOR
The foundation of a "Power" Order Block is the displacement that follows it. For a zone to be considered valid, the market must move away from it with significant force.
The script uses a Displacement Multiplier to ensure quality:
• It compares the size of the engulfing candle to the previous candle's range.
• If the breakout candle isn't large enough relative to the setup candle, the zone is ignored.
• This filters out low-conviction market noise and focuses on areas of true institutional sponsorship.
🔶 THE POWER RATING SYSTEM
Every detected block is assigned a "Power" percentage. This rating provides immediate context regarding the strength of the move that created the zone.
• Calculation: The indicator compares the current displacement candle against the largest candle observed over a 100-bar lookback.
• Meaning: A 100% Power rating indicates the strongest displacement seen in recent history, suggesting a massive imbalance between buyers and sellers.
• Visual Intensity: When Power Intensity is enabled, the fill color of each block becomes more vivid as its Power % increases. High-power zones are immediately visible at a glance — weaker zones fade into the background naturally.
This allows traders to prioritize "High Power" zones, which typically offer more significant structural support or resistance.
🔶 DYNAMIC ZONE MANAGEMENT
The indicator manages zones dynamically to keep the chart clean and relevant:
🔶 THE INFO PANEL
Each active Order Block renders a dedicated Info Panel — a secondary box that floats at the right edge of the zone and updates in real time.
The panel displays:
• Zone Direction: "Bullish OB" or "Bearish OB"
• Power %: The relative displacement strength at the time of formation
• Touch Counter: How many times price has tapped the zone boundary without breaking it
The touch counter is particularly valuable — a zone that has been tested multiple times without breaking demonstrates strong institutional defense and may represent a higher-conviction setup.
🔶 EQUILIBRIUM LINE
When Show Equilibrium Line is enabled, a line is drawn at the exact midpoint (50% level) of each Order Block.
• This level represents the theoretical "fair value" within the zone.
• Price often reacts precisely at the equilibrium before continuing in the original direction.
• It provides a refined entry reference within a wider zone, improving risk-to-reward on entries.
🔶 RETEST SIGNALS (MITIGATION)
When Show Retest Labels is enabled, the script monitors active zones for price interaction.
• If price returns to touch the boundary of a Bullish OB without breaking it, an upward arrow ⇡ appears below the bar.
• If price returns to touch the boundary of a Bearish OB without breaking it, a downward arrow ⇣ appears above the bar.
• A minimum 10-bar cooldown between signals prevents label spam on extended zone interactions.
• Each confirmed retest also increments the Touch Counter inside the Info Panel.
🔶 VISUAL ELEMENTS
🔶 HOW TO USE
🔶 SETTINGS REFERENCE
🔶 CONCLUSION
Power Order Blocks [ChartPrime] provides a systematic way to map institutional footprint on the chart. By combining strict displacement validation with a relative power rating, live info panels, equilibrium mapping, and touch tracking, it transforms raw price action into a clear and actionable map of supply and demand imbalances — allowing traders to trade alongside the strongest market moves with precision and confidence.
Power Order Blocks [ChartPrime] is an advanced structural detection engine designed to identify high-probability supply and demand zones. Unlike standard order block indicators, this tool focuses on "Power" — the intensity of the displacement following the block's formation, combined with a live information panel, equilibrium mapping, and touch tracking built directly into each zone.
It identifies the specific candle where institutional participants likely placed large orders, marks the resulting price inefficiency, and tracks these zones in real time until they are either mitigated or invalidated.
🔶 CORE CONCEPT — THE DISPLACEMENT VALIDATOR
The foundation of a "Power" Order Block is the displacement that follows it. For a zone to be considered valid, the market must move away from it with significant force.
The script uses a Displacement Multiplier to ensure quality:
• It compares the size of the engulfing candle to the previous candle's range.
• If the breakout candle isn't large enough relative to the setup candle, the zone is ignored.
• This filters out low-conviction market noise and focuses on areas of true institutional sponsorship.
🔶 THE POWER RATING SYSTEM
Every detected block is assigned a "Power" percentage. This rating provides immediate context regarding the strength of the move that created the zone.
• Calculation: The indicator compares the current displacement candle against the largest candle observed over a 100-bar lookback.
• Meaning: A 100% Power rating indicates the strongest displacement seen in recent history, suggesting a massive imbalance between buyers and sellers.
• Visual Intensity: When Power Intensity is enabled, the fill color of each block becomes more vivid as its Power % increases. High-power zones are immediately visible at a glance — weaker zones fade into the background naturally.
This allows traders to prioritize "High Power" zones, which typically offer more significant structural support or resistance.
🔶 DYNAMIC ZONE MANAGEMENT
The indicator manages zones dynamically to keep the chart clean and relevant:
- Bullish Order Blocks (Demand): Formed when a bearish candle is followed by a high-displacement bullish candle. The zone is invalidated if price closes below the bottom of the block.
- Bearish Order Blocks (Supply): Formed when a bullish candle is followed by a high-displacement bearish candle. The zone is invalidated if price closes above the top of the block.
- Overlapping Cleanup: If a new order block forms that significantly overlaps an existing one, the script automatically removes the older, redundant zone to prevent clutter.
- Block Limit: A maximum of 10 active blocks per side are tracked at any time, ensuring chart performance remains clean.
🔶 THE INFO PANEL
Each active Order Block renders a dedicated Info Panel — a secondary box that floats at the right edge of the zone and updates in real time.
The panel displays:
• Zone Direction: "Bullish OB" or "Bearish OB"
• Power %: The relative displacement strength at the time of formation
• Touch Counter: How many times price has tapped the zone boundary without breaking it
The touch counter is particularly valuable — a zone that has been tested multiple times without breaking demonstrates strong institutional defense and may represent a higher-conviction setup.
🔶 EQUILIBRIUM LINE
When Show Equilibrium Line is enabled, a line is drawn at the exact midpoint (50% level) of each Order Block.
• This level represents the theoretical "fair value" within the zone.
• Price often reacts precisely at the equilibrium before continuing in the original direction.
• It provides a refined entry reference within a wider zone, improving risk-to-reward on entries.
🔶 RETEST SIGNALS (MITIGATION)
When Show Retest Labels is enabled, the script monitors active zones for price interaction.
• If price returns to touch the boundary of a Bullish OB without breaking it, an upward arrow ⇡ appears below the bar.
• If price returns to touch the boundary of a Bearish OB without breaking it, a downward arrow ⇣ appears above the bar.
• A minimum 10-bar cooldown between signals prevents label spam on extended zone interactions.
• Each confirmed retest also increments the Touch Counter inside the Info Panel.
🔶 VISUAL ELEMENTS
- Main OB Body: A filled rectangle spanning the order block's price range, extending forward in time. Fill intensity reflects the Power % when Power Intensity is enabled.
- Info Panel: A secondary box at the right edge of each zone displaying Power % and Touch Count, updated live.
- Equilibrium Line: A midpoint line inside each block marking the 50% level of the zone.
- Retest Arrows: Clean arrow labels (⇡ / ⇣) marking the first tap into an active zone.
- Color Coding: Fully customizable colors for Bullish (Demand) and Bearish (Supply) zones.
🔶 HOW TO USE
- Entry Zones: Wait for price to return to a high-power zone. The Retest Arrow confirms the touch. Consider entries near the equilibrium line for tighter stops.
- Zone Prioritization: Use the Power % to filter setups. Zones rated 70%+ represent the strongest institutional imbalances and are generally more reliable.
- Touch Count Context: A zone with 0 touches is fresh and untested — typically the highest probability. Zones with multiple touches may be weakening.
- Trend Confirmation: In a healthy trend, the market should consistently create and respect Power Order Blocks in the direction of the trend.
- Stop Loss Placement: Order blocks provide logical structural levels for stops — just below a Bullish OB bottom or above a Bearish OB top.
- Confluence: Combine the Power Rating, Equilibrium Line, and Touch Count together for the highest-quality setups.
🔶 SETTINGS REFERENCE
- Displacement Multiplier: Controls how aggressive the displacement filter is. Higher values require a stronger engulfing move to validate a zone.
- Bullish / Bearish OB Color: Set the fill color for each zone type.
- Text Color: Controls the color of text inside the Info Panel.
- Show Equilibrium Line: Toggles the midpoint line inside each block.
- Power Intensity: When enabled, fill transparency scales with Power % — stronger zones appear more vivid.
- Show Retest Labels: Toggles the ⇡ / ⇣ arrow labels on zone interactions.
🔶 CONCLUSION
Power Order Blocks [ChartPrime] provides a systematic way to map institutional footprint on the chart. By combining strict displacement validation with a relative power rating, live info panels, equilibrium mapping, and touch tracking, it transforms raw price action into a clear and actionable map of supply and demand imbalances — allowing traders to trade alongside the strongest market moves with precision and confidence.
오픈 소스 스크립트
트레이딩뷰의 진정한 정신에 따라, 이 스크립트의 작성자는 이를 오픈소스로 공개하여 트레이더들이 기능을 검토하고 검증할 수 있도록 했습니다. 작성자에게 찬사를 보냅니다! 이 코드는 무료로 사용할 수 있지만, 코드를 재게시하는 경우 하우스 룰이 적용된다는 점을 기억하세요.

면책사항
해당 정보와 게시물은 금융, 투자, 트레이딩 또는 기타 유형의 조언이나 권장 사항으로 간주되지 않으며, 트레이딩뷰에서 제공하거나 보증하는 것이 아닙니다. 자세한 내용은 이용 약관을 참조하세요.
오픈 소스 스크립트
트레이딩뷰의 진정한 정신에 따라, 이 스크립트의 작성자는 이를 오픈소스로 공개하여 트레이더들이 기능을 검토하고 검증할 수 있도록 했습니다. 작성자에게 찬사를 보냅니다! 이 코드는 무료로 사용할 수 있지만, 코드를 재게시하는 경우 하우스 룰이 적용된다는 점을 기억하세요.
면책사항
해당 정보와 게시물은 금융, 투자, 트레이딩 또는 기타 유형의 조언이나 권장 사항으로 간주되지 않으며, 트레이딩뷰에서 제공하거나 보증하는 것이 아닙니다. 자세한 내용은 이용 약관을 참조하세요.