Volume Spike Trend & Momentum Suite [AlgoChief]
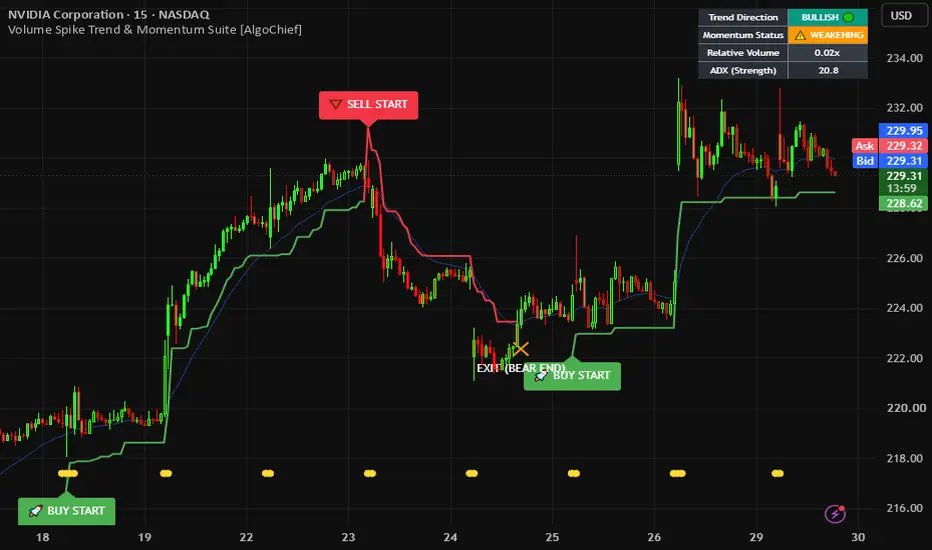
Volume Spike Trend & Momentum Engine is a systematic trading tool designed to identify the exact moments institutional volume enters the market. Instead of relying solely on lagging price action, this indicator anchors trend direction to statistical volume expansions (RVOL), tracks active momentum health, and plots dynamic ATR-based trailing stops to clearly mark both trend inception and exhaustion.
How It Works
1. Relative Volume Spike Detection
The script calculates real-time Relative Volume (RVOL) against a dynamic simple moving average of volume. When current volume expands beyond user-defined thresholds (default 1.8x), the engine flags an institutional volume event with a bottom marker.
2. Trend Initiation and Direction Confirmation
A trend is confirmed only when a volume spike coincides with price closing in alignment with the underlying baseline moving average.
A bullish trend begins when volume surges and price closes above the baseline EMA.
A bearish trend begins when volume surges and price closes below the baseline EMA.
3. Real-Time Momentum Classification
Not all trends move with the same velocity. The script integrates directional movement index (ADX) and volume persistence to classify candle momentum into two states:
Bright candles indicate high velocity, strong volume, and expanding momentum.
Dark candles indicate fading momentum and volume drying up, warning traders of potential consolidation or pullback.
4. Dynamic Trailing Exit Logic
Rather than using static profit targets, the indicator implements a ratcheting Average True Range (ATR) trailing stop line. In an uptrend, the stop only moves upward; in a downtrend, it only moves downward. A close beyond this trailing threshold formally signals trend termination.
Visual Elements on Chart
Green Buy Start Label: Confirmed initiation of an uptrend with volume backing.
Red Sell Start Label: Confirmed initiation of a downtrend with volume backing.
Orange Exit Label: Breakout of the ATR trailing baseline, signaling trend completion.
Yellow Candle Dots: Highlights exact bars where relative volume exceeds the spike multiplier.
Color-Coded Candles: Bright colors for active high momentum, muted dark colors for slowing momentum.
On-Screen Status Table: Live top-right dashboard displaying current trend regime, momentum state, relative volume factor, and trend strength values.
Trading Applications
This indicator is versatile across multiple asset classes including Crypto, Forex, Indices, and Equities.
Intraday Trading: 5-minute and 15-minute charts for breakout and momentum scalping.
Swing Trading: 1-hour, 4-hour, and Daily charts for capturing multi-day trending legs.
Risk Disclaimer
This indicator is published strictly for educational and analytical purposes. No indicator or algorithmic calculation can guarantee market outcomes or financial gains. Always apply disciplined risk management, proper position sizing, and independent technical verification before placing live trades.

For access & queries: algochiefsupport@gmail.com
면책사항
해당 정보와 게시물은 금융, 투자, 트레이딩 또는 기타 유형의 조언이나 권장 사항으로 간주되지 않으며, 트레이딩뷰에서 제공하거나 보증하는 것이 아닙니다. 자세한 내용은 이용 약관을 참조하세요.
For access & queries: algochiefsupport@gmail.com
면책사항
해당 정보와 게시물은 금융, 투자, 트레이딩 또는 기타 유형의 조언이나 권장 사항으로 간주되지 않으며, 트레이딩뷰에서 제공하거나 보증하는 것이 아닙니다. 자세한 내용은 이용 약관을 참조하세요.