BTC Average Daily Returns by Day
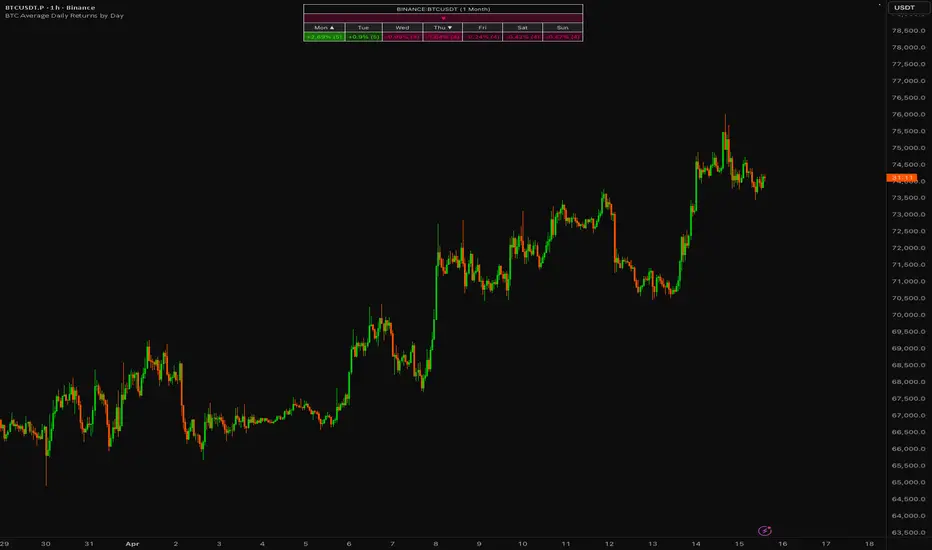
Average Daily Returns by Day
A clean weekday performance dashboard that shows the average daily return for each day of the week using a selectable lookback period.
The script uses daily data internally, so it stays consistent across chart timeframes while letting you view the stats directly on your chart as either a table or a centered top bar.
Features
How to use
Use it to quickly see whether a market has recently shown stronger or weaker performance on specific weekdays. It works best as a context tool alongside price action, structure, volatility, and broader market conditions.
Important
This indicator is descriptive, not predictive. Weekday tendencies can shift, especially on shorter lookbacks, so it should not be used as a standalone signal.

A clean weekday performance dashboard that shows the average daily return for each day of the week using a selectable lookback period.
The script uses daily data internally, so it stays consistent across chart timeframes while letting you view the stats directly on your chart as either a table or a centered top bar.
Features
- Weekday average returns
- 1W, 2W, 1M, 3M, 6M, 1Y lookbacks
- Table or top bar display
- Current-day bias signal built into the UI
- Optional heatmap, best/worst day highlight, and sample count
- Custom colors and preset themes
How to use
Use it to quickly see whether a market has recently shown stronger or weaker performance on specific weekdays. It works best as a context tool alongside price action, structure, volatility, and broader market conditions.
Important
This indicator is descriptive, not predictive. Weekday tendencies can shift, especially on shorter lookbacks, so it should not be used as a standalone signal.

면책사항
해당 정보와 게시물은 금융, 투자, 트레이딩 또는 기타 유형의 조언이나 권장 사항으로 간주되지 않으며, 트레이딩뷰에서 제공하거나 보증하는 것이 아닙니다. 자세한 내용은 이용 약관을 참조하세요.
면책사항
해당 정보와 게시물은 금융, 투자, 트레이딩 또는 기타 유형의 조언이나 권장 사항으로 간주되지 않으며, 트레이딩뷰에서 제공하거나 보증하는 것이 아닙니다. 자세한 내용은 이용 약관을 참조하세요.