Low Since DateTime * X Level
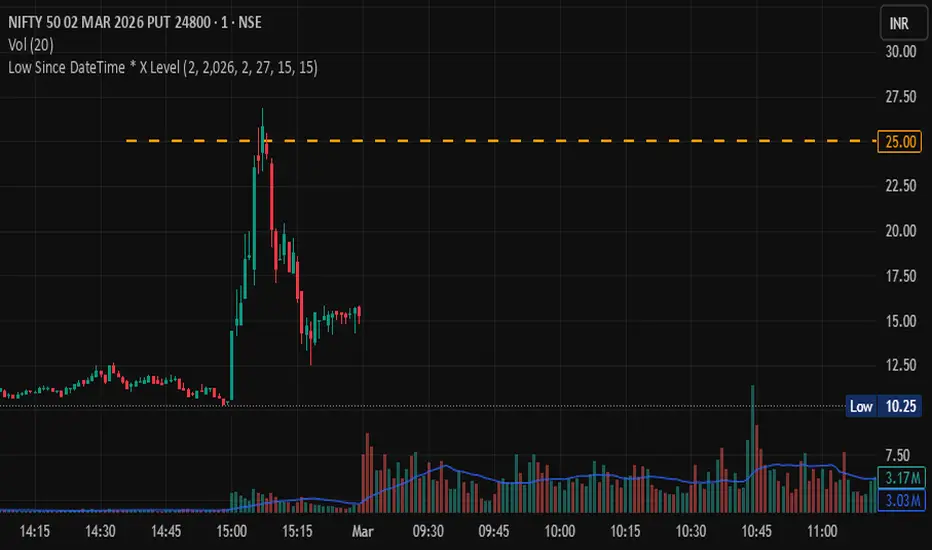
Low Since DateTime × X LevelThis indicator tracks the lowest price from a user-defined DateTime up to the current bar and plots a dynamic horizontal level at that low multiplied by a custom factor X.How it works:
You define an exact start DateTime (date + time) as the reference point
The indicator scans every bar from that DateTime to the present and finds the absolute lowest low
Multiplies that low by X to compute the target level
Draws a dashed horizontal line at that level extending across the chart
Displays a label with the full formula and exact computed price
Pins the price value on the right-side price axis for instant reference
Use Cases:
Track key levels relative to session lows, event lows, or specific market structure points
Useful for options traders monitoring premium levels relative to a reference low
Identify dynamic support/resistance as a multiple of a significant low
Works on any timeframe — intraday, daily, weekly
You define an exact start DateTime (date + time) as the reference point
The indicator scans every bar from that DateTime to the present and finds the absolute lowest low
Multiplies that low by X to compute the target level
Draws a dashed horizontal line at that level extending across the chart
Displays a label with the full formula and exact computed price
Pins the price value on the right-side price axis for instant reference
Use Cases:
Track key levels relative to session lows, event lows, or specific market structure points
Useful for options traders monitoring premium levels relative to a reference low
Identify dynamic support/resistance as a multiple of a significant low
Works on any timeframe — intraday, daily, weekly

면책사항
해당 정보와 게시물은 금융, 투자, 트레이딩 또는 기타 유형의 조언이나 권장 사항으로 간주되지 않으며, 트레이딩뷰에서 제공하거나 보증하는 것이 아닙니다. 자세한 내용은 이용 약관을 참조하세요.
면책사항
해당 정보와 게시물은 금융, 투자, 트레이딩 또는 기타 유형의 조언이나 권장 사항으로 간주되지 않으며, 트레이딩뷰에서 제공하거나 보증하는 것이 아닙니다. 자세한 내용은 이용 약관을 참조하세요.