업데이트됨
GBR Micro Kernel Trend [Laplace Smoothing]
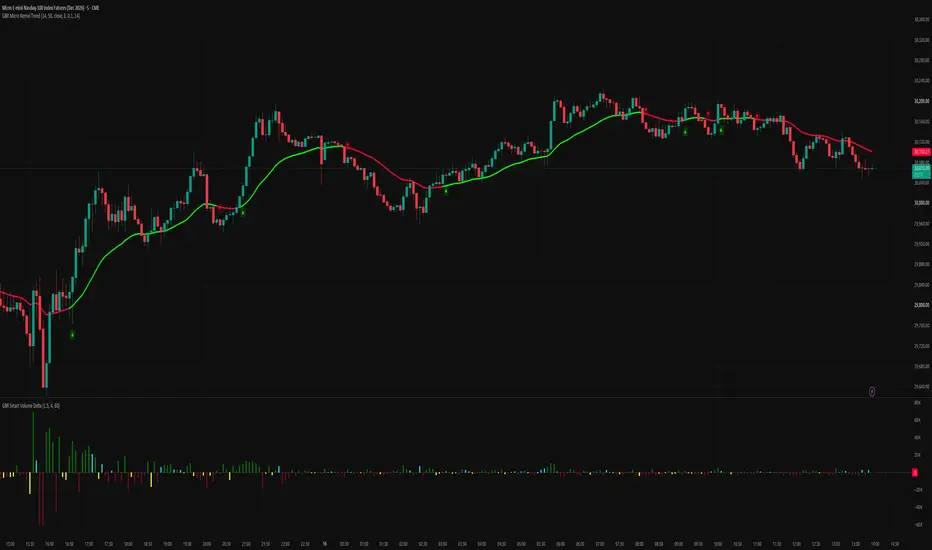
The GBR Micro Kernel Trend is the ultimate solution for lower-timeframe scalpers (1m-5m) who are tired of traditional moving averages whipping them out of trades.
Instead of basic averaging, this indicator utilizes a Nadaraya-Watson Kernel Regression (with a Laplace probability distribution) to dynamically smooth out market noise. The result is a buttery-smooth trend line that doesn't blindly hug the candles, allowing the price to breathe during minor pullbacks.
🔥 Core Features:
Laplace Smoothing Engine: Filters out erratic wicks and micro-chop, focusing strictly on the true directional momentum.
Adjustable Bandwidth (h): Fully customizable. Increase the 'h' value to distance the line from the price for longer holds, or decrease it for hyper-sensitive scalp entries.
Minimalist Sniper Signals: Stripped of all retail clutter. Provides elegant, low-opacity UV Green ▲ and UV Red ▼ markers exclusively at trend reversal points.
Strictly Non-Repainting: Operates strictly on closed bar data. Once a signal is printed, it stays there.
🎯 How to execute:
Wait for the noise to settle. Enter your trade when the Kernel line shifts color and prints the reversal marker. For the highest win rate, ensure your entries align with a higher timeframe macro trend.
Instead of basic averaging, this indicator utilizes a Nadaraya-Watson Kernel Regression (with a Laplace probability distribution) to dynamically smooth out market noise. The result is a buttery-smooth trend line that doesn't blindly hug the candles, allowing the price to breathe during minor pullbacks.
🔥 Core Features:
Laplace Smoothing Engine: Filters out erratic wicks and micro-chop, focusing strictly on the true directional momentum.
Adjustable Bandwidth (h): Fully customizable. Increase the 'h' value to distance the line from the price for longer holds, or decrease it for hyper-sensitive scalp entries.
Minimalist Sniper Signals: Stripped of all retail clutter. Provides elegant, low-opacity UV Green ▲ and UV Red ▼ markers exclusively at trend reversal points.
Strictly Non-Repainting: Operates strictly on closed bar data. Once a signal is printed, it stays there.
🎯 How to execute:
Wait for the noise to settle. Enter your trade when the Kernel line shifts color and prints the reversal marker. For the highest win rate, ensure your entries align with a higher timeframe macro trend.
릴리즈 노트
v2.0 — The direction no longer flips on movements too small to seeThree changes. One is a genuine bug, one makes the indicator usable, and
one corrects what the arrows claim.
1. The line was wrong at the start of the chart
The kernel loop always ran the full window and treated bars that do not
exist yet as zero. Those zeros went into the weighted average, so for
the first fifty bars or so the line sat far below price before
converging. Only the left edge of the chart was affected, but it was
affected on every chart. The loop is now limited to the bars that
actually exist.
2. A turn now has to be a turn
The direction came from comparing the line to its own value one bar
earlier. On a smoothed line that still flips on the smallest wiggle, and
every flip drew an arrow — which is why there were so many of them.
A direction change now needs two things: the line has to have been
moving the same way for several bars, and it has to have travelled a
minimum distance measured in ATR. Both are adjustable. Set the minimum
distance to zero and you get the old behaviour back.
Expect considerably fewer arrows. Raise the minimum distance to 0.2 or
0.3 ATR if you want fewer still.
3. "Buy Signal" and "Sell Signal" became "Turned up" and "Turned down"
What the script detects is the direction of a smoothed average changing.
Some of those turns are worth trading and most are not, and the script
cannot tell which at the time. The markers now say what happened.
Other changes:
- Alerts added for both directions. There were none before
- The direction markers can be switched off if you only want the line
- Colours are configurable
- Tooltips and comments in English
One thing worth stating plainly, since it is unusual: this indicator
does not repaint. It uses only past bars and no higher-timeframe
requests, so the line you see on history is exactly the line that was
there at the time. The cost is lag — a kernel average is an average of
the past, and it will be late at every turn. That is the trade, and it
cannot be engineered away.

면책사항
해당 정보와 게시물은 금융, 투자, 트레이딩 또는 기타 유형의 조언이나 권장 사항으로 간주되지 않으며, 트레이딩뷰에서 제공하거나 보증하는 것이 아닙니다. 자세한 내용은 이용 약관을 참조하세요.
면책사항
해당 정보와 게시물은 금융, 투자, 트레이딩 또는 기타 유형의 조언이나 권장 사항으로 간주되지 않으며, 트레이딩뷰에서 제공하거나 보증하는 것이 아닙니다. 자세한 내용은 이용 약관을 참조하세요.