OPEN-SOURCE SCRIPT
Cowboy's Recursion Squares (CRS)
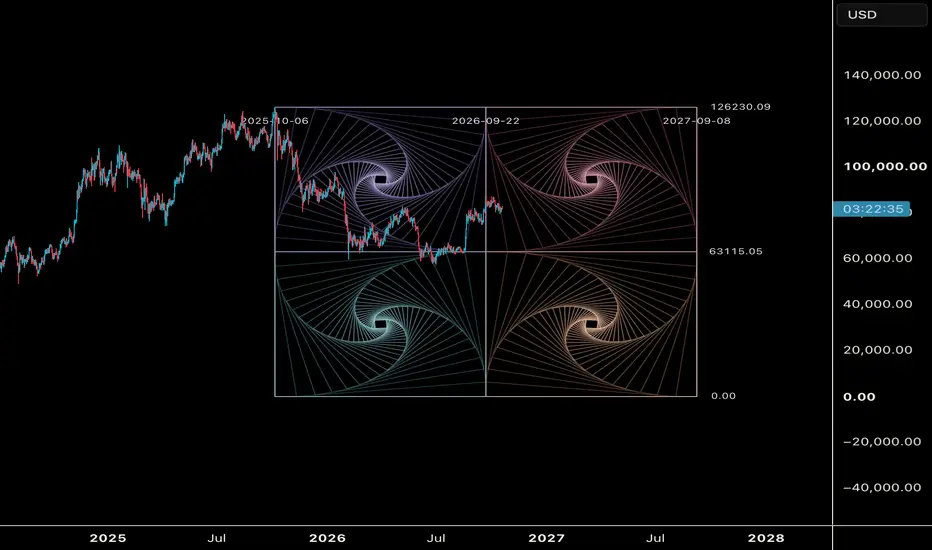
COWBOY RECURSION SQUARES
Straight lines + rotation + recursion = curves that aren't there.
THE CONCEPT
Start with one square. Move each corner 10% of the way toward the next corner, then connect the four new points. You get a smaller square, slightly rotated. Repeat this many times and spirals appear, even though every line on the chart is perfectly straight.
Each step uses the same rule:
A(n+1) = (1 − λ)·A(n) + λ·B(n)
With λ = 0.10, every new square turns about 6.34° and shrinks to about 90.55% of the one before it. The four quadrants are mirror images of each other, so their spirals turn in opposite directions and meet along the center line.
HOW TO USE
1. Add the indicator to your chart.
2. Click two points: the bottom-left corner (time and price), then the top-right corner.
3. The master square is drawn between those two points, the same way you'd anchor a Gann Box. You can extend it into the future to project time.
4. To move it later, open Settings and edit the anchor times and prices.
CUSTOMIZE
• Layout: a 2x2 mirrored grid, or a single square
• λ (step size): smaller values make tighter, slower spirals; larger values make faster rotation
• Depth: how many nested squares each quadrant draws
• Mirror quadrants: turn on or off
• Reverse spin: flip the rotation direction
• Colors: a separate color for each quadrant, or one color for everything (Mono)
• Outer fade and core glow: lines brighten toward the center of each spiral
• Overlays: frame, 50% price/time cross, diagonals, the highlighted corner spiral, and price/date labels
NOTES
• The geometry is drawn inside your box, so it stretches with whatever price and time range you set.
• Price and time scale differently, so the squares can look like rectangles on some charts. Adjust the chart's scale for a true square.
• This is a geometry and visualization tool, not a buy or sell signal. Use it together with your own analysis of structure, levels and timing.
YEEHAW
오픈 소스 스크립트
트레이딩뷰의 진정한 정신에 따라, 이 스크립트의 작성자는 이를 오픈소스로 공개하여 트레이더들이 기능을 검토하고 검증할 수 있도록 했습니다. 작성자에게 찬사를 보냅니다! 이 코드는 무료로 사용할 수 있지만, 코드를 재게시하는 경우 하우스 룰이 적용된다는 점을 기억하세요.

면책사항
해당 정보와 게시물은 금융, 투자, 트레이딩 또는 기타 유형의 조언이나 권장 사항으로 간주되지 않으며, 트레이딩뷰에서 제공하거나 보증하는 것이 아닙니다. 자세한 내용은 이용 약관을 참조하세요.
오픈 소스 스크립트
트레이딩뷰의 진정한 정신에 따라, 이 스크립트의 작성자는 이를 오픈소스로 공개하여 트레이더들이 기능을 검토하고 검증할 수 있도록 했습니다. 작성자에게 찬사를 보냅니다! 이 코드는 무료로 사용할 수 있지만, 코드를 재게시하는 경우 하우스 룰이 적용된다는 점을 기억하세요.
면책사항
해당 정보와 게시물은 금융, 투자, 트레이딩 또는 기타 유형의 조언이나 권장 사항으로 간주되지 않으며, 트레이딩뷰에서 제공하거나 보증하는 것이 아닙니다. 자세한 내용은 이용 약관을 참조하세요.