OPEN-SOURCE SCRIPT
업데이트됨 Dynamic MSS Navigator [MarkitTick]
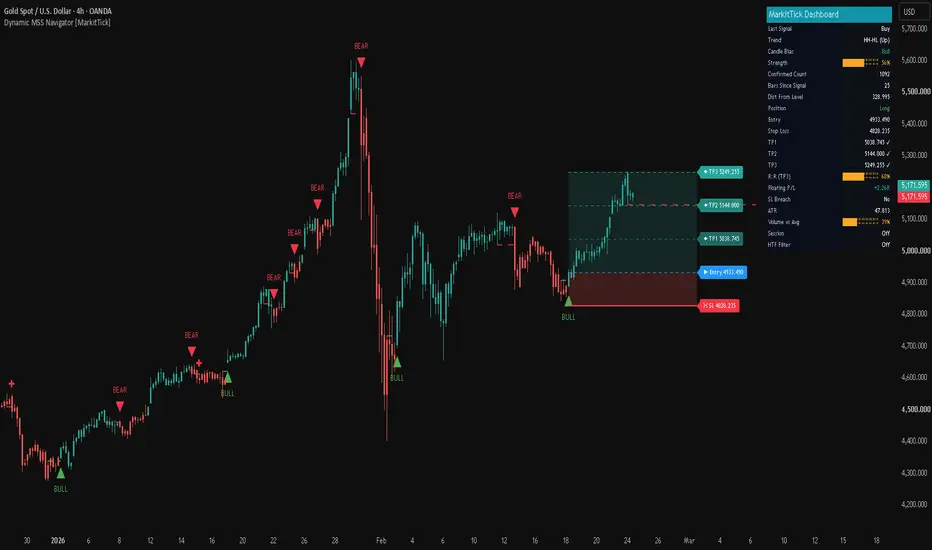
💡 An advanced technical analysis tool engineered to automatically identify localized market structure, validate structural shifts, and dynamically generate risk-to-reward parameters. Built for systematic traders, it continuously scans price action to pinpoint candidate highs and lows based on user-defined lookback periods. Rather than relying on subjective charting, this indicator applies stringent mathematical logic—incorporating Average True Range (ATR) buffers, volume participation, and higher timeframe (HTF) alignment—to filter out market noise and present high-probability structural breaks. Once a valid break occurs, the indicator seamlessly transitions into trade management mode, drawing precise entry, stop-loss, and multiple take-profit levels directly onto the chart, accompanied by a comprehensive real-time data dashboard.
✨ Originality and Utility
● Automated Market Structure Mapping
The core utility of this indicator lies in its ability to remove human bias from market structure analysis. Traders often struggle with defining which highs and lows are structurally significant. This script mathematically defines them, tracking the absolute highest highs and lowest lows over a rolling window, and only recognizing a structural shift when a mathematically validated threshold is breached.
● Dynamic Risk-to-Reward Modeling
Unlike standard indicators that only print buy or sell arrows, this tool instantly calculates the exact risk parameter upon signal generation. By anchoring the stop-loss to the structural pivot with a built-in volatility buffer, it sizes the risk logically. It then extrapolates multiple take-profit targets based on fixed risk-to-reward ratios, providing a complete trade framework from inception to completion.
● Multi-Dimensional Filtering Mashup
This script operates as a highly cohesive mashup of distinct technical methodologies. It combines Donchian-style localized pivot detection for structure, Wilder’s Average True Range for volatility-based breakout validation, Simple Moving Averages of volume for participation measurement, and multi-timeframe security requests for overarching trend alignment. This combination ensures that a signal is only fired when price action, volatility, volume, and higher timeframe momentum are in total agreement.
🔬 Methodology and Concepts

● Localized Pivot Identification
The script continuously monitors the highest highs and lowest lows over a defined lookback period. When a new top is formed, it identifies the lowest point of that peak structure as the "Candidate Top Low." Conversely, when a new bottom forms, it marks the highest point of that valley structure as the "Candidate Bottom High." These form the immediate structural floors and ceilings.
● ATR-Buffered Breakout Logic
To confirm a shift, price must do more than just tick past the candidate line. The indicator requires price to breach the candidate level by an additional margin, calculated as a fraction of the current ATR. This ensures that only shifts with statistically significant momentum trigger a signal, heavily reducing false positives (fake-outs) during low-volatility chop.
● Composite Strength Scoring
Upon signal generation, the algorithm calculates a proprietary "Strength Score" from 0 to 100. This score is a weighted aggregate of three factors:
● Dynamic Bias Tracking
The indicator tracks the ongoing market bias, classifying it as bullish, bearish, or neutral. A bullish bias is initiated upon a valid bottom break and remains intact until price breaches the newly established stop-loss level, at which point the bias flips or neutralizing protocols take over.
🎨 Visual Guide

● Chart Elements
• Candidate Lines
Dashed Red Lines indicate the support floor of a localized top. Dashed Green Lines indicate the resistance ceiling of a localized bottom. These project forward to show the exact price level that must be broken.
• Signal Markers
When a structural shift is validated, a solid Red Triangle appears above the bar for a bearish shift (labeled "BEAR"), and a solid Green Triangle appears below the bar for a bullish shift (labeled "BULL"). Small "+" cross icons appear for continuation signals where the trend is reinforced.
• Trade Projection Lines
A solid Red Line marks the calculated Stop Loss level. A dashed Blue Line marks the exact Entry Price. Dashed Teal Lines of varying opacities mark Take Profit 1 (TP1), Take Profit 2 (TP2), and Take Profit 3 (TP3).
• Zonal Fills
A semi-transparent Red Background fill connects the Entry line to the Stop Loss line, visually representing the initial capital risk. A semi-transparent Green Background fill connects the Entry line to the final TP3 line, representing the total projected reward zone.
• Heatmap Candles
The indicator takes control of the underlying candlestick colors to reflect the current structural bias. Deep Teal candles indicate an active bullish trend, Deep Red candles indicate an active bearish trend, and Gray candles indicate a neutral market state where structural direction is unresolved.
● Dashboard Readouts
A highly detailed heads-up display is rendered on the chart, featuring a dark background with bright, contrasting text. It provides rows of vital data including:
📌 Note : the best way to resolve visual overlap is to navigate to the Object Tree and drag the indicator above the main chart layer, or simply hide the native candles in your chart settings.
📖 How to Use

● Signal Execution
Traders should monitor the formation of the dashed candidate lines. When a breakout occurs, do not act prematurely; wait for the candle to close (if "Confirm by Close" is active) and ensure the primary signal triangle prints. This confirms that all volume and volatility parameters have been met.
● Assessing Trade Quality
Immediately consult the dashboard's "Strength Score." Higher scores (e.g., above 75%) indicate robust volume participation and excellent higher timeframe alignment, making them higher probability setups. Lower scores may warrant reduced position sizing or skipping the setup entirely.
● Trade Management
Utilize the dynamically plotted lines to set limit orders and stop losses in your execution platform. As price reaches TP1 and TP2 (indicated by checkmarks on the dashboard), consider trailing the stop loss to breakeven or the next logical structure point. If the candle heatmap shifts to gray (neutral) before reaching targets, it may be a prudent early exit warning.
⚙️ Inputs and Settings
● Core Settings
● Filters
● Trade Tools
● Visuals & Dashboard
Allows the user to toggle the display of candidate lines, heatmaps, and the main data dashboard, as well as reposition the dashboard to any corner of the screen.
● Alerts
Customizable string inputs for JSON payload generation, allowing traders to map long, short, close, trail, and target-hit actions directly to automated execution systems.
🔍 Deconstruction of the Underlying Scientific and Academic Framework
● Dow Theory and Structural Extremes
The foundational logic of this script is rooted in classical Dow Theory, which posits that a trend is defined by a sequence of higher highs and higher lows (bullish) or lower highs and lower lows (bearish). By mathematically indexing `highestbars` and `lowestbars`, the script algorithmically isolates these fractal extremes, stripping away subjective human interpretation of market swings.
● Volatility-Normalized Breakout Thresholds
Financial markets are noisy, characterized by frequent false breaks (liquidity sweeps). This indicator employs Average True Range (ATR), a metric developed by J. Welles Wilder, to normalize the breakout threshold against current market volatility. By requiring price to exceed a structural level by a factor of the ATR, the algorithm relies on statistical significance—demanding that the breakout possesses enough standard deviations of momentum to be classified as a genuine shift in supply and demand, rather than random market drift.
● Volume Participation Theory
Drawing on Volume Price Trend (VPT) mechanics, the algorithm recognizes that price movement without volume is highly suspect. The implementation of a volume moving average filter ensures that structural breaks are validated by a true influx of market participation, confirming that the imbalance between buyers and sellers is robust enough to sustain a new directional vector.
● Automated Expected Value (EV) Projection
By mechanically tying the entry price to a mathematically defined stop-loss, and extrapolating predetermined Risk-to-Reward targets, the script enforces strict expected value mechanics. This removes emotional profit-taking, ensuring that winning trades scale out at mathematically optimal R-multiples (e.g., 1R, 2R, 3R), aligning the trader's execution with positive expectancy mathematical models over a large sample size of trades.
⚠️ Disclaimer
All provided scripts and indicators are strictly for educational exploration and must not be interpreted as financial advice or a recommendation to execute trades. We expressly disclaim all liability for any financial losses or damages that may result, directly or indirectly, from the reliance on or application of these tools. Market participation carries inherent risk where past performance never guarantees future returns, leaving all investment decisions and due diligence solely at your own discretion.
✨ Originality and Utility
● Automated Market Structure Mapping
The core utility of this indicator lies in its ability to remove human bias from market structure analysis. Traders often struggle with defining which highs and lows are structurally significant. This script mathematically defines them, tracking the absolute highest highs and lowest lows over a rolling window, and only recognizing a structural shift when a mathematically validated threshold is breached.
● Dynamic Risk-to-Reward Modeling
Unlike standard indicators that only print buy or sell arrows, this tool instantly calculates the exact risk parameter upon signal generation. By anchoring the stop-loss to the structural pivot with a built-in volatility buffer, it sizes the risk logically. It then extrapolates multiple take-profit targets based on fixed risk-to-reward ratios, providing a complete trade framework from inception to completion.
● Multi-Dimensional Filtering Mashup
This script operates as a highly cohesive mashup of distinct technical methodologies. It combines Donchian-style localized pivot detection for structure, Wilder’s Average True Range for volatility-based breakout validation, Simple Moving Averages of volume for participation measurement, and multi-timeframe security requests for overarching trend alignment. This combination ensures that a signal is only fired when price action, volatility, volume, and higher timeframe momentum are in total agreement.
🔬 Methodology and Concepts
● Localized Pivot Identification
The script continuously monitors the highest highs and lowest lows over a defined lookback period. When a new top is formed, it identifies the lowest point of that peak structure as the "Candidate Top Low." Conversely, when a new bottom forms, it marks the highest point of that valley structure as the "Candidate Bottom High." These form the immediate structural floors and ceilings.
● ATR-Buffered Breakout Logic
To confirm a shift, price must do more than just tick past the candidate line. The indicator requires price to breach the candidate level by an additional margin, calculated as a fraction of the current ATR. This ensures that only shifts with statistically significant momentum trigger a signal, heavily reducing false positives (fake-outs) during low-volatility chop.
● Composite Strength Scoring
Upon signal generation, the algorithm calculates a proprietary "Strength Score" from 0 to 100. This score is a weighted aggregate of three factors:
- The distance of the closing price beyond the breakout threshold (measuring immediate momentum).
- The current volume relative to its moving average (measuring market participation).
- The alignment of the localized pivot with the higher timeframe pivot (measuring macro confluence).
● Dynamic Bias Tracking
The indicator tracks the ongoing market bias, classifying it as bullish, bearish, or neutral. A bullish bias is initiated upon a valid bottom break and remains intact until price breaches the newly established stop-loss level, at which point the bias flips or neutralizing protocols take over.
🎨 Visual Guide
● Chart Elements
• Candidate Lines
Dashed Red Lines indicate the support floor of a localized top. Dashed Green Lines indicate the resistance ceiling of a localized bottom. These project forward to show the exact price level that must be broken.
• Signal Markers
When a structural shift is validated, a solid Red Triangle appears above the bar for a bearish shift (labeled "BEAR"), and a solid Green Triangle appears below the bar for a bullish shift (labeled "BULL"). Small "+" cross icons appear for continuation signals where the trend is reinforced.
• Trade Projection Lines
A solid Red Line marks the calculated Stop Loss level. A dashed Blue Line marks the exact Entry Price. Dashed Teal Lines of varying opacities mark Take Profit 1 (TP1), Take Profit 2 (TP2), and Take Profit 3 (TP3).
• Zonal Fills
A semi-transparent Red Background fill connects the Entry line to the Stop Loss line, visually representing the initial capital risk. A semi-transparent Green Background fill connects the Entry line to the final TP3 line, representing the total projected reward zone.
• Heatmap Candles
The indicator takes control of the underlying candlestick colors to reflect the current structural bias. Deep Teal candles indicate an active bullish trend, Deep Red candles indicate an active bearish trend, and Gray candles indicate a neutral market state where structural direction is unresolved.
● Dashboard Readouts
A highly detailed heads-up display is rendered on the chart, featuring a dark background with bright, contrasting text. It provides rows of vital data including:
- Last Signal and Trend State (e.g., HH-HL Up).
- Candle Bias and a visual bar chart representing the Strength Score.
- Confirmed Signal Count and Bars Since the Last Signal.
- Active Position status, Entry Price, and Stop Loss Price.
- Dynamic tick boxes for TP1, TP2, and TP3 displaying price levels and completion checkmarks.
- Real-time Floating P/L (Profit/Loss) expressed in 'R' multiples.
- Current ATR values and Volume vs Average visual bar meters.
- Current state of Session and HTF filters.
📌 Note : the best way to resolve visual overlap is to navigate to the Object Tree and drag the indicator above the main chart layer, or simply hide the native candles in your chart settings.
📖 How to Use
● Signal Execution
Traders should monitor the formation of the dashed candidate lines. When a breakout occurs, do not act prematurely; wait for the candle to close (if "Confirm by Close" is active) and ensure the primary signal triangle prints. This confirms that all volume and volatility parameters have been met.
● Assessing Trade Quality
Immediately consult the dashboard's "Strength Score." Higher scores (e.g., above 75%) indicate robust volume participation and excellent higher timeframe alignment, making them higher probability setups. Lower scores may warrant reduced position sizing or skipping the setup entirely.
● Trade Management
Utilize the dynamically plotted lines to set limit orders and stop losses in your execution platform. As price reaches TP1 and TP2 (indicated by checkmarks on the dashboard), consider trailing the stop loss to breakeven or the next logical structure point. If the candle heatmap shifts to gray (neutral) before reaching targets, it may be a prudent early exit warning.
⚙️ Inputs and Settings
● Core Settings
- Lookback: Defines the number of bars used to identify localized tops and bottoms. Higher values find macro structures; lower values find micro structures.
- Confirm by Close: Toggles whether the breakout must be confirmed by the candle's closing price or just the wick.
- ATR Len & ATR Break Mult: Controls the volatility buffer required to validate a breakout.
● Filters
- Volume Confirm: Requires breakout volume to exceed the moving average multiplied by the "Vol Spike Mult".
- HTF Confluence: Restricts signals to those that align with the high/low structure of the user-defined Higher Timeframe.
- Session Filter: Restricts signal generation to a specific daily time window (e.g., standard market hours).
● Trade Tools
- TP1, TP2, TP3 R:R: Defines the static Risk-to-Reward multipliers for the take profit targets.
- SL ATR Buffer: Adds additional breathing room to the stop loss beyond the absolute structural pivot.
● Visuals & Dashboard
Allows the user to toggle the display of candidate lines, heatmaps, and the main data dashboard, as well as reposition the dashboard to any corner of the screen.
● Alerts
Customizable string inputs for JSON payload generation, allowing traders to map long, short, close, trail, and target-hit actions directly to automated execution systems.
🔍 Deconstruction of the Underlying Scientific and Academic Framework
● Dow Theory and Structural Extremes
The foundational logic of this script is rooted in classical Dow Theory, which posits that a trend is defined by a sequence of higher highs and higher lows (bullish) or lower highs and lower lows (bearish). By mathematically indexing `highestbars` and `lowestbars`, the script algorithmically isolates these fractal extremes, stripping away subjective human interpretation of market swings.
● Volatility-Normalized Breakout Thresholds
Financial markets are noisy, characterized by frequent false breaks (liquidity sweeps). This indicator employs Average True Range (ATR), a metric developed by J. Welles Wilder, to normalize the breakout threshold against current market volatility. By requiring price to exceed a structural level by a factor of the ATR, the algorithm relies on statistical significance—demanding that the breakout possesses enough standard deviations of momentum to be classified as a genuine shift in supply and demand, rather than random market drift.
● Volume Participation Theory
Drawing on Volume Price Trend (VPT) mechanics, the algorithm recognizes that price movement without volume is highly suspect. The implementation of a volume moving average filter ensures that structural breaks are validated by a true influx of market participation, confirming that the imbalance between buyers and sellers is robust enough to sustain a new directional vector.
● Automated Expected Value (EV) Projection
By mechanically tying the entry price to a mathematically defined stop-loss, and extrapolating predetermined Risk-to-Reward targets, the script enforces strict expected value mechanics. This removes emotional profit-taking, ensuring that winning trades scale out at mathematically optimal R-multiples (e.g., 1R, 2R, 3R), aligning the trader's execution with positive expectancy mathematical models over a large sample size of trades.
⚠️ Disclaimer
All provided scripts and indicators are strictly for educational exploration and must not be interpreted as financial advice or a recommendation to execute trades. We expressly disclaim all liability for any financial losses or damages that may result, directly or indirectly, from the reliance on or application of these tools. Market participation carries inherent risk where past performance never guarantees future returns, leaving all investment decisions and due diligence solely at your own discretion.
릴리즈 노트
Refined the underlying logic릴리즈 노트
Efficiency Update: Refined internal algorithms for more precise signal delivery and reduced latency.오픈 소스 스크립트
트레이딩뷰의 진정한 정신에 따라, 이 스크립트의 작성자는 이를 오픈소스로 공개하여 트레이더들이 기능을 검토하고 검증할 수 있도록 했습니다. 작성자에게 찬사를 보냅니다! 이 코드는 무료로 사용할 수 있지만, 코드를 재게시하는 경우 하우스 룰이 적용된다는 점을 기억하세요.

💡 Proprietary indicators. Original research. Built by analysts who trade.
📢 Free Telegram: t.me/MarkitTick_Updates
👑 Premium: markittick.com
📢 Free Telegram: t.me/MarkitTick_Updates
👑 Premium: markittick.com
면책사항
해당 정보와 게시물은 금융, 투자, 트레이딩 또는 기타 유형의 조언이나 권장 사항으로 간주되지 않으며, 트레이딩뷰에서 제공하거나 보증하는 것이 아닙니다. 자세한 내용은 이용 약관을 참조하세요.
오픈 소스 스크립트
트레이딩뷰의 진정한 정신에 따라, 이 스크립트의 작성자는 이를 오픈소스로 공개하여 트레이더들이 기능을 검토하고 검증할 수 있도록 했습니다. 작성자에게 찬사를 보냅니다! 이 코드는 무료로 사용할 수 있지만, 코드를 재게시하는 경우 하우스 룰이 적용된다는 점을 기억하세요.
💡 Proprietary indicators. Original research. Built by analysts who trade.
📢 Free Telegram: t.me/MarkitTick_Updates
👑 Premium: markittick.com
📢 Free Telegram: t.me/MarkitTick_Updates
👑 Premium: markittick.com
면책사항
해당 정보와 게시물은 금융, 투자, 트레이딩 또는 기타 유형의 조언이나 권장 사항으로 간주되지 않으며, 트레이딩뷰에서 제공하거나 보증하는 것이 아닙니다. 자세한 내용은 이용 약관을 참조하세요.