업데이트됨
Monthly DCA Tracker by Equityram
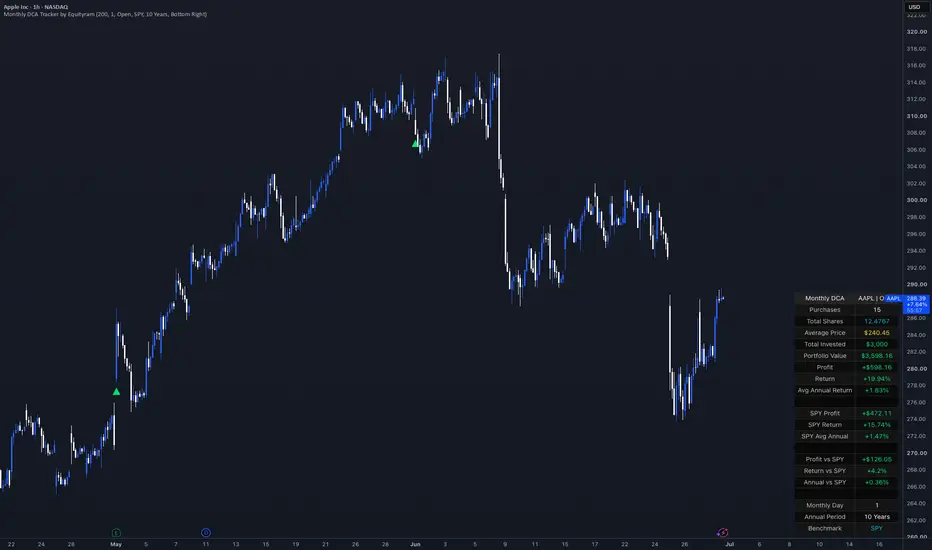
Monthly DCA Tracker by Equityram helps investors test how a simple dollar-cost averaging strategy would have performed on any chart.
The indicator simulates investing a fixed amount every month, starting from a selected date. Users can choose the monthly investment amount, preferred monthly investment day, execution price type, benchmark symbol, annual return period, and table position.
The table shows:
• Total purchases
• Total shares accumulated
• Average purchase price
• Total invested
• Current portfolio value
• Profit
• Total return
• Average annual return
• Benchmark profit
• Benchmark return
• Benchmark average annual return
• Profit and return comparison versus the selected benchmark
If the selected monthly investment day is not available on the chart, the script uses the next available trading day.
This tool is designed for educational backtesting and long-term investing analysis. It does not provide financial advice, buy/sell recommendations, or future performance predictions.
The indicator simulates investing a fixed amount every month, starting from a selected date. Users can choose the monthly investment amount, preferred monthly investment day, execution price type, benchmark symbol, annual return period, and table position.
The table shows:
• Total purchases
• Total shares accumulated
• Average purchase price
• Total invested
• Current portfolio value
• Profit
• Total return
• Average annual return
• Benchmark profit
• Benchmark return
• Benchmark average annual return
• Profit and return comparison versus the selected benchmark
If the selected monthly investment day is not available on the chart, the script uses the next available trading day.
This tool is designed for educational backtesting and long-term investing analysis. It does not provide financial advice, buy/sell recommendations, or future performance predictions.
릴리즈 노트
-
면책사항
해당 정보와 게시물은 금융, 투자, 트레이딩 또는 기타 유형의 조언이나 권장 사항으로 간주되지 않으며, 트레이딩뷰에서 제공하거나 보증하는 것이 아닙니다. 자세한 내용은 이용 약관을 참조하세요.
면책사항
해당 정보와 게시물은 금융, 투자, 트레이딩 또는 기타 유형의 조언이나 권장 사항으로 간주되지 않으며, 트레이딩뷰에서 제공하거나 보증하는 것이 아닙니다. 자세한 내용은 이용 약관을 참조하세요.