Dynamic Fib Fan - Market Structure (BOS/CHoCH)
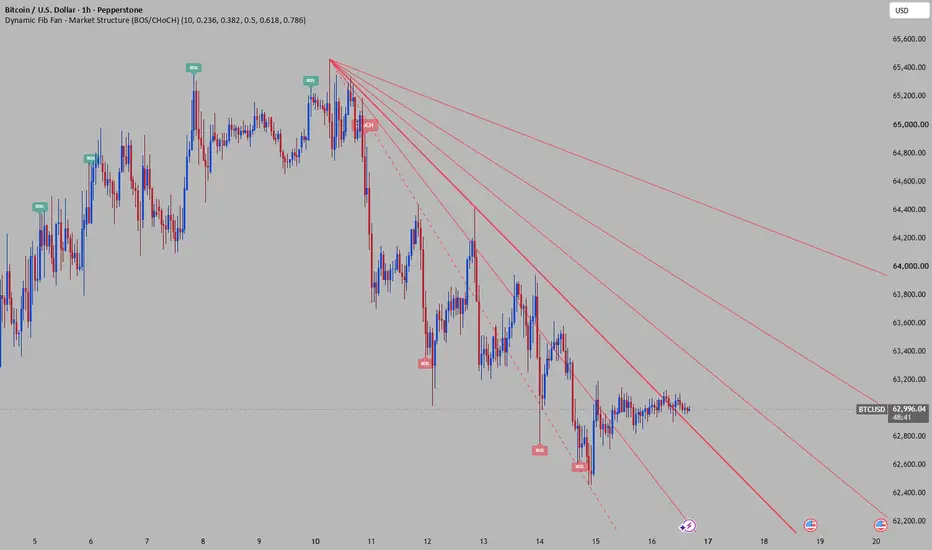
Fibonacci Fan Resistance indicator use as resistance or support integrated with support or resistance.
How this works
Pivot Period (Lookback): By default, this uses 10 candles on the left and right to confirm a swing high/low. You can tighten this to 5 for faster, short-term trends, or expand it to 20 for macroeconomic moves.
BoS & CHoCH Logic:
A Break of Structure (BoS) happens when a trend continues by breaking and closing past the most recently confirmed Pivot point.
A Change of Character (CHoCH) happens when the price reverses and breaks the structural extreme of the opposing side (e.g., in a Bull market, closing beneath the last valid Higher Low).
The Fibonacci Fan Dynamics: The script relies on barstate.islast to redraw the fan on the active ticker in real-time.
If the market is Bullish, the script locks the start of the Fan to the absolute lowest point before the run started. It tracks the highest high dynamically, extending the Fan support upwards.
If a Bearish CHoCH occurs, the script instantly anchors a new Fan to the highest peak of that bull run, and projects the Fan downwards tracking the fresh lows as resistance.
How this works
Pivot Period (Lookback): By default, this uses 10 candles on the left and right to confirm a swing high/low. You can tighten this to 5 for faster, short-term trends, or expand it to 20 for macroeconomic moves.
BoS & CHoCH Logic:
A Break of Structure (BoS) happens when a trend continues by breaking and closing past the most recently confirmed Pivot point.
A Change of Character (CHoCH) happens when the price reverses and breaks the structural extreme of the opposing side (e.g., in a Bull market, closing beneath the last valid Higher Low).
The Fibonacci Fan Dynamics: The script relies on barstate.islast to redraw the fan on the active ticker in real-time.
If the market is Bullish, the script locks the start of the Fan to the absolute lowest point before the run started. It tracks the highest high dynamically, extending the Fan support upwards.
If a Bearish CHoCH occurs, the script instantly anchors a new Fan to the highest peak of that bull run, and projects the Fan downwards tracking the fresh lows as resistance.

면책사항
해당 정보와 게시물은 금융, 투자, 트레이딩 또는 기타 유형의 조언이나 권장 사항으로 간주되지 않으며, 트레이딩뷰에서 제공하거나 보증하는 것이 아닙니다. 자세한 내용은 이용 약관을 참조하세요.
면책사항
해당 정보와 게시물은 금융, 투자, 트레이딩 또는 기타 유형의 조언이나 권장 사항으로 간주되지 않으며, 트레이딩뷰에서 제공하거나 보증하는 것이 아닙니다. 자세한 내용은 이용 약관을 참조하세요.