업데이트됨
ReadableTimeframeAlerts
More exclusive indicators from AfnanTAjuddin
Subscribe to Supply & Demand Price Action Toolkit for $8.49/month to get exclusive indicators by this author. You pay right on TradingView and can use them on your charts straight away.
Explore Supply & Demand Price Action ToolkitFixes the "what timeframe is this?" problem.
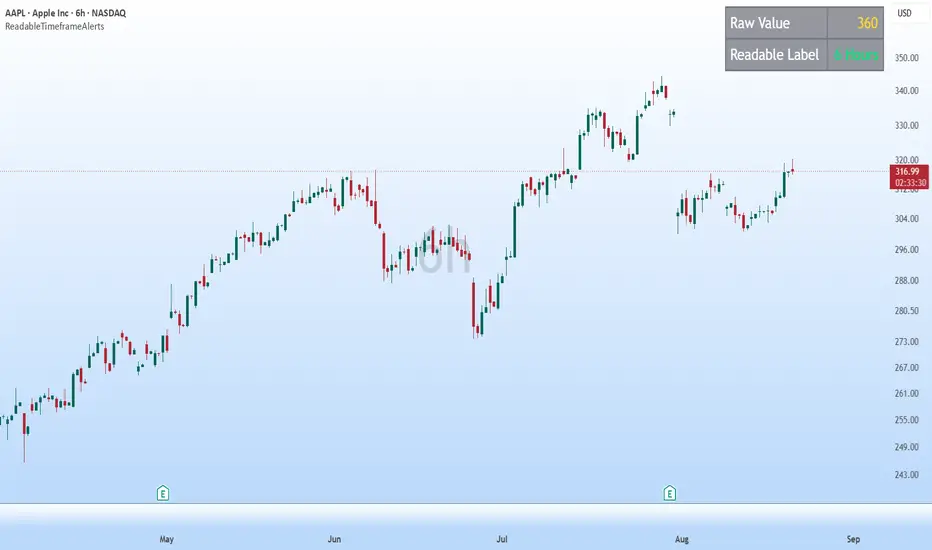
Pine's timeframe.period gives you raw values like "60", "240", "1D", "3M" — accurate, but not something a normal user can read at a glance. If your alert says "Zone formed on 360," most people have no idea that 360 means the 6-hour timeframe.
This library converts that raw string into a proper readable label: "60" becomes "1 Hour", "240" becomes "4 Hours", "1D" becomes "Daily", "3M" becomes "3 Months", and so on — covering minutes, hours, days, weeks, months, seconds, and ticks.
I built this after running into the exact issue in my own — a user kept seeing numbers like 360 in their alerts and couldn't tell what timeframe it referred to. This library is what fixed it, and I'm sharing it so anyone facing the same confusion can drop it into their own script.
Usage:
import AfnanTAjuddin/ReadableTimeframeAlerts/1 as tf
alert("Zone formed on " + tf.f_tf_label(timeframe.period))
One line, and your alert messages, labels, or tables show a timeframe users actually understand instead of a raw number.
Found an edge case it doesn't handle correctly? Drop a comment and I'll take a look.
Pine's timeframe.period gives you raw values like "60", "240", "1D", "3M" — accurate, but not something a normal user can read at a glance. If your alert says "Zone formed on 360," most people have no idea that 360 means the 6-hour timeframe.
This library converts that raw string into a proper readable label: "60" becomes "1 Hour", "240" becomes "4 Hours", "1D" becomes "Daily", "3M" becomes "3 Months", and so on — covering minutes, hours, days, weeks, months, seconds, and ticks.
I built this after running into the exact issue in my own — a user kept seeing numbers like 360 in their alerts and couldn't tell what timeframe it referred to. This library is what fixed it, and I'm sharing it so anyone facing the same confusion can drop it into their own script.
Usage:
import AfnanTAjuddin/ReadableTimeframeAlerts/1 as tf
alert("Zone formed on " + tf.f_tf_label(timeframe.period))
One line, and your alert messages, labels, or tables show a timeframe users actually understand instead of a raw number.
Found an edge case it doesn't handle correctly? Drop a comment and I'll take a look.
릴리즈 노트
v2Updated:
f_tf_label(tf)
Converts a TradingView timeframe string into a readable label.
Parameters:
tf (simple string): Timeframe string such as "60", "240", "D", "1D", "3M", etc.
Library Updated
Fixed an issue where D, W, and M could show as NaN Days/Weeks/Months.
The library now supports both timeframe.period and input.timeframe values, including D/1D, W/1W, and M/1M, with clean, readable timeframe labels.
릴리즈 노트
v3Library Updated 🚀
Now supports both timeframe.period and input.timeframe() values, including Chart, D/1D, W/1W, and M/1M.
Fixed the NaN timeframe issue and improved Chart handling — when Chart is selected, it now shows the actual chart timeframe in a readable format.

Access Demand and Supply Zone Pro indicator at:
tradingview.com/scripts/marketplace/AfnanTAjuddin/
Stay updated on Telegram:
t.me/MarketUp2Date
Join our WhatsApp channel:
whatsapp.com/channel/0029Va6ByyH0LKZCc4Az4x0u
tradingview.com/scripts/marketplace/AfnanTAjuddin/
Stay updated on Telegram:
t.me/MarketUp2Date
Join our WhatsApp channel:
whatsapp.com/channel/0029Va6ByyH0LKZCc4Az4x0u
면책사항
해당 정보와 게시물은 금융, 투자, 트레이딩 또는 기타 유형의 조언이나 권장 사항으로 간주되지 않으며, 트레이딩뷰에서 제공하거나 보증하는 것이 아닙니다. 자세한 내용은 이용 약관을 참조하세요.
Access Demand and Supply Zone Pro indicator at:
tradingview.com/scripts/marketplace/AfnanTAjuddin/
Stay updated on Telegram:
t.me/MarketUp2Date
Join our WhatsApp channel:
whatsapp.com/channel/0029Va6ByyH0LKZCc4Az4x0u
tradingview.com/scripts/marketplace/AfnanTAjuddin/
Stay updated on Telegram:
t.me/MarketUp2Date
Join our WhatsApp channel:
whatsapp.com/channel/0029Va6ByyH0LKZCc4Az4x0u
면책사항
해당 정보와 게시물은 금융, 투자, 트레이딩 또는 기타 유형의 조언이나 권장 사항으로 간주되지 않으며, 트레이딩뷰에서 제공하거나 보증하는 것이 아닙니다. 자세한 내용은 이용 약관을 참조하세요.