OPEN-SOURCE SCRIPT
Hourly Candle Open Tracker (R2F)
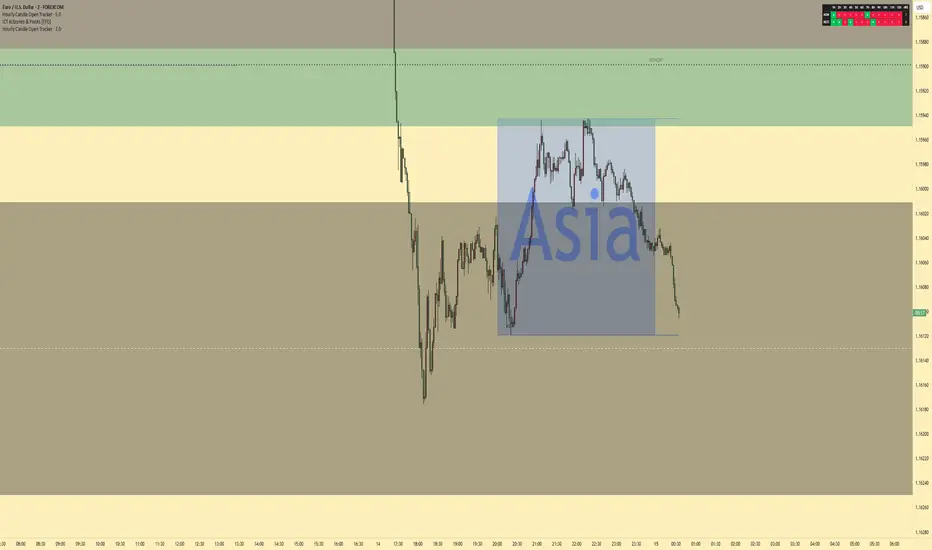
Hourly Candle Start & Formation Tracker
This indicator is designed to help traders clearly identify which hourly candle has started during the current hour, as well as which hourly candle is forming for the next hour.
The tool tracks hourly candle cycles from Hour 1 through Hour 12, making it easier to follow time-based market structure, session rhythm, and candle sequencing directly on your chart.
It provides a simple visual reference for traders who use hourly candle timing as part of their strategy, whether for entries, exits, confirmations, or observing how price behaves as each hourly candle opens and develops.
Key Features
Identifies the current hourly candle that has started
Shows which hourly candle is forming next
Covers hourly cycles from 1 to 12
Helps improve awareness of candle timing and session flow
Useful for intraday traders, scalpers, and time-based strategies
Clean and easy-to-read display directly on the chart
How It Can Be Used
This indicator can help traders stay aligned with hourly candle changes and prepare for the next candle formation before it begins. It may be useful for traders who watch specific hourly candles for volatility, reversals, continuation moves, liquidity grabs, or session-based setups.
Disclaimer
This indicator is intended for informational and educational purposes only. It does not provide buy or sell signals and should not be used as financial advice. Always combine it with your own analysis, risk management, and trading plan.
This indicator is designed to help traders clearly identify which hourly candle has started during the current hour, as well as which hourly candle is forming for the next hour.
The tool tracks hourly candle cycles from Hour 1 through Hour 12, making it easier to follow time-based market structure, session rhythm, and candle sequencing directly on your chart.
It provides a simple visual reference for traders who use hourly candle timing as part of their strategy, whether for entries, exits, confirmations, or observing how price behaves as each hourly candle opens and develops.
Key Features
Identifies the current hourly candle that has started
Shows which hourly candle is forming next
Covers hourly cycles from 1 to 12
Helps improve awareness of candle timing and session flow
Useful for intraday traders, scalpers, and time-based strategies
Clean and easy-to-read display directly on the chart
How It Can Be Used
This indicator can help traders stay aligned with hourly candle changes and prepare for the next candle formation before it begins. It may be useful for traders who watch specific hourly candles for volatility, reversals, continuation moves, liquidity grabs, or session-based setups.
Disclaimer
This indicator is intended for informational and educational purposes only. It does not provide buy or sell signals and should not be used as financial advice. Always combine it with your own analysis, risk management, and trading plan.
오픈 소스 스크립트
트레이딩뷰의 진정한 정신에 따라, 이 스크립트의 작성자는 이를 오픈소스로 공개하여 트레이더들이 기능을 검토하고 검증할 수 있도록 했습니다. 작성자에게 찬사를 보냅니다! 이 코드는 무료로 사용할 수 있지만, 코드를 재게시하는 경우 하우스 룰이 적용된다는 점을 기억하세요.

면책사항
해당 정보와 게시물은 금융, 투자, 트레이딩 또는 기타 유형의 조언이나 권장 사항으로 간주되지 않으며, 트레이딩뷰에서 제공하거나 보증하는 것이 아닙니다. 자세한 내용은 이용 약관을 참조하세요.
오픈 소스 스크립트
트레이딩뷰의 진정한 정신에 따라, 이 스크립트의 작성자는 이를 오픈소스로 공개하여 트레이더들이 기능을 검토하고 검증할 수 있도록 했습니다. 작성자에게 찬사를 보냅니다! 이 코드는 무료로 사용할 수 있지만, 코드를 재게시하는 경우 하우스 룰이 적용된다는 점을 기억하세요.
면책사항
해당 정보와 게시물은 금융, 투자, 트레이딩 또는 기타 유형의 조언이나 권장 사항으로 간주되지 않으며, 트레이딩뷰에서 제공하거나 보증하는 것이 아닙니다. 자세한 내용은 이용 약관을 참조하세요.