업데이트됨
Blockunity Master Oscillator (BMO)
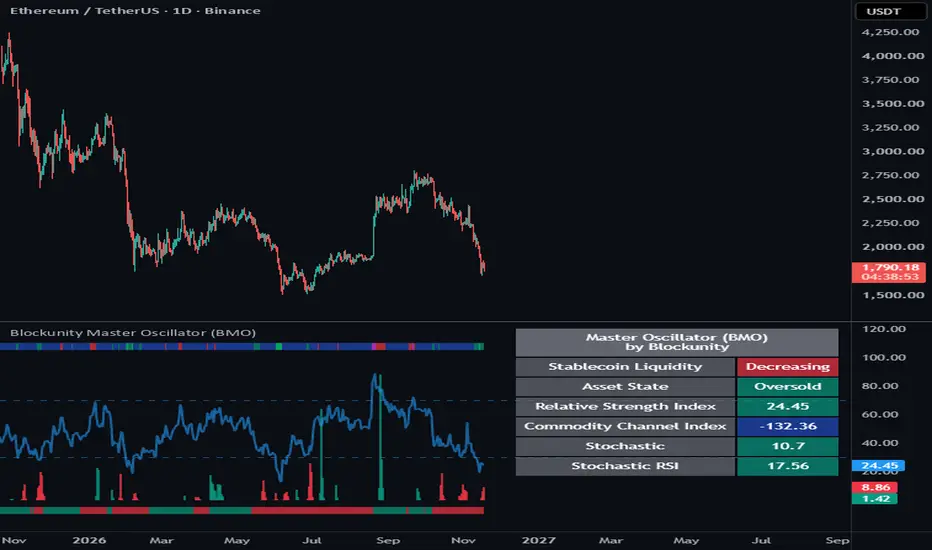
The perfect oscillator for tracking the state of cryptoassets, especially regarding profits and losses.
The Idea
Master Oscillator (BMO) is the perfect tool for tracking the status of cryptoassets. Observe and visualize when profits or losses are realized. Get information on market liquidity. And know when an asset becomes too overbought or oversold, indicating strong momentum or a reversal zone. With it, the market can no longer hide anything from you.
How to Use
The indicator is easy to use, there's nothing special about it. Just make sure you use it on at least a daily time unit, and prefer Stablecoin pairs.
Elements
The Master Oscillator has several distinct components:
Realized Profits and Losses
Next, we can see red and green peaks, which indicate when big losses or profits have been made. This is precious information, because it can support the idea of having a market top or bottom depending on the intensity of the profits or losses made. For example, circled here, we had big losses, and we had a bottom where the market rallied right after.

Liquidity Status
After that, we'll have some information on market liquidity. First of all, we're going to see whether the number of Stablecoins in circulation is increasing or decreasing. We also have this information on the bottom line of the oscillator. When it's green, the number of Stablecoins is increasing; when it's red, it's decreasing. When it's green, it's a pretty good sign for the market. Once again, if you want to go further, you can take a look at the Stablecoin Liquidity (BSL), a free tool.

Asset State
We now have information on the overheating state of the asset. Here, we'll indicate whether it's strongly overbought, overbought, oversold or strongly oversold. This is represented by the top line on the oscillator. And once again, those who want to go further can take a look at the Ultimatyx Oscillator (BUO), which is the oscillator from which this data comes.

Settings
Several parameters can be defined in the indicator configuration.
Firstly, you have a language selector to switch the table information between several languages.
You can then choose whether or not to display the various elements.
Switch Asset State (Ultimatyx) with Excess Index: This parameter is used to display Excess Index (BEI) data instead of Ultimatyx in the top line of the oscillator. The goal of BEI is to identify excess zones resulting in market reversals by visualizing price deviations from an average.

Normalize Realized Profit and Loss: Checked by default, we apply normalization to Realized PnL for better visualization. This can be removed to obtain the raw data.
You can then modify the Excess Index (BEI) and Ultimatyx parameters.
Finally, you can display the values of several technical indicators in the table, such as the RSI, which is displayed by default. You can also show the RSI line in the oscillator:

Lastly, you can modify all table parameters.
The Idea
Master Oscillator (BMO) is the perfect tool for tracking the status of cryptoassets. Observe and visualize when profits or losses are realized. Get information on market liquidity. And know when an asset becomes too overbought or oversold, indicating strong momentum or a reversal zone. With it, the market can no longer hide anything from you.
How to Use
The indicator is easy to use, there's nothing special about it. Just make sure you use it on at least a daily time unit, and prefer Stablecoin pairs.
Elements
The Master Oscillator has several distinct components:
Realized Profits and Losses
Next, we can see red and green peaks, which indicate when big losses or profits have been made. This is precious information, because it can support the idea of having a market top or bottom depending on the intensity of the profits or losses made. For example, circled here, we had big losses, and we had a bottom where the market rallied right after.
Liquidity Status
After that, we'll have some information on market liquidity. First of all, we're going to see whether the number of Stablecoins in circulation is increasing or decreasing. We also have this information on the bottom line of the oscillator. When it's green, the number of Stablecoins is increasing; when it's red, it's decreasing. When it's green, it's a pretty good sign for the market. Once again, if you want to go further, you can take a look at the Stablecoin Liquidity (BSL), a free tool.
Asset State
We now have information on the overheating state of the asset. Here, we'll indicate whether it's strongly overbought, overbought, oversold or strongly oversold. This is represented by the top line on the oscillator. And once again, those who want to go further can take a look at the Ultimatyx Oscillator (BUO), which is the oscillator from which this data comes.
Settings
Several parameters can be defined in the indicator configuration.
Firstly, you have a language selector to switch the table information between several languages.
You can then choose whether or not to display the various elements.
Switch Asset State (Ultimatyx) with Excess Index: This parameter is used to display Excess Index (BEI) data instead of Ultimatyx in the top line of the oscillator. The goal of BEI is to identify excess zones resulting in market reversals by visualizing price deviations from an average.
Normalize Realized Profit and Loss: Checked by default, we apply normalization to Realized PnL for better visualization. This can be removed to obtain the raw data.
You can then modify the Excess Index (BEI) and Ultimatyx parameters.
Finally, you can display the values of several technical indicators in the table, such as the RSI, which is displayed by default. You can also show the RSI line in the oscillator:
Lastly, you can modify all table parameters.
릴리즈 노트
It is now possible to display the Percentage of Whales line from the parameters:Same for the Percentage of long-term Holders line:
릴리즈 노트
- It is now possible to display the Ultimatyx Oscillator in place of the Master Oscillator data.
- Adjustment of text in some descriptions.
릴리즈 노트
- Minor changes of some colors and french texts.
릴리즈 노트
- Data query optimization.
- Fixed a problem where the FIAT printing status could flicker.
릴리즈 노트
Remove Money Printer Index.The required data now requires a specific additional subscription on TradingView.
릴리즈 노트
Removal of some on-chain data that are no longer available on TradingView.
Blockunity
app.blockunity.io/
unyx-data.com/
contact@blockunity.io
app.blockunity.io/
unyx-data.com/
contact@blockunity.io
면책사항
해당 정보와 게시물은 금융, 투자, 트레이딩 또는 기타 유형의 조언이나 권장 사항으로 간주되지 않으며, 트레이딩뷰에서 제공하거나 보증하는 것이 아닙니다. 자세한 내용은 이용 약관을 참조하세요.
Blockunity
app.blockunity.io/
unyx-data.com/
contact@blockunity.io
app.blockunity.io/
unyx-data.com/
contact@blockunity.io
면책사항
해당 정보와 게시물은 금융, 투자, 트레이딩 또는 기타 유형의 조언이나 권장 사항으로 간주되지 않으며, 트레이딩뷰에서 제공하거나 보증하는 것이 아닙니다. 자세한 내용은 이용 약관을 참조하세요.