OPEN-SOURCE SCRIPT
Descriptive Statistics [Variance]
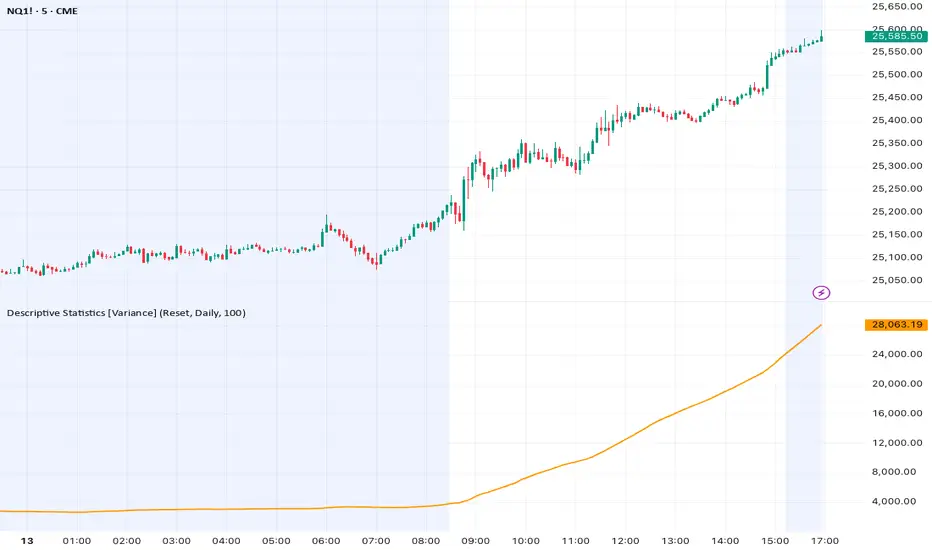
This indicator displays the Mean and Variance of price over a selected dataset. It is designed to describe the central value of price and the degree of dispersion around it.
The Mean represents the average price level over the selected period. It acts as the central reference point of the dataset.
Variance measures how spread out price values are around the Mean. It reflects the degree of variability or instability in price movement over time.
What it shows?
1. Mean: The average price level of the selected data.
2. Variance: The average squared deviation of price from the Mean.
Key concept
1. The Mean describes the center of price behavior.
2. The Variance describes how widely price moves around that center.
Together, they provide a basic statistical view of market structure and volatility.
⚠️ Note
This indicator is for analytical and educational purposes only and does not provide trading signals or directional predictions.
AUTHOR: TUGUME WILLIAM MUTARA
The Mean represents the average price level over the selected period. It acts as the central reference point of the dataset.
Variance measures how spread out price values are around the Mean. It reflects the degree of variability or instability in price movement over time.
What it shows?
1. Mean: The average price level of the selected data.
2. Variance: The average squared deviation of price from the Mean.
Key concept
1. The Mean describes the center of price behavior.
2. The Variance describes how widely price moves around that center.
Together, they provide a basic statistical view of market structure and volatility.
⚠️ Note
This indicator is for analytical and educational purposes only and does not provide trading signals or directional predictions.
AUTHOR: TUGUME WILLIAM MUTARA
오픈 소스 스크립트
트레이딩뷰의 진정한 정신에 따라, 이 스크립트의 작성자는 이를 오픈소스로 공개하여 트레이더들이 기능을 검토하고 검증할 수 있도록 했습니다. 작성자에게 찬사를 보냅니다! 이 코드는 무료로 사용할 수 있지만, 코드를 재게시하는 경우 하우스 룰이 적용된다는 점을 기억하세요.

면책사항
해당 정보와 게시물은 금융, 투자, 트레이딩 또는 기타 유형의 조언이나 권장 사항으로 간주되지 않으며, 트레이딩뷰에서 제공하거나 보증하는 것이 아닙니다. 자세한 내용은 이용 약관을 참조하세요.
오픈 소스 스크립트
트레이딩뷰의 진정한 정신에 따라, 이 스크립트의 작성자는 이를 오픈소스로 공개하여 트레이더들이 기능을 검토하고 검증할 수 있도록 했습니다. 작성자에게 찬사를 보냅니다! 이 코드는 무료로 사용할 수 있지만, 코드를 재게시하는 경우 하우스 룰이 적용된다는 점을 기억하세요.
면책사항
해당 정보와 게시물은 금융, 투자, 트레이딩 또는 기타 유형의 조언이나 권장 사항으로 간주되지 않으며, 트레이딩뷰에서 제공하거나 보증하는 것이 아닙니다. 자세한 내용은 이용 약관을 참조하세요.