MTF Red Bar Ver:1.0
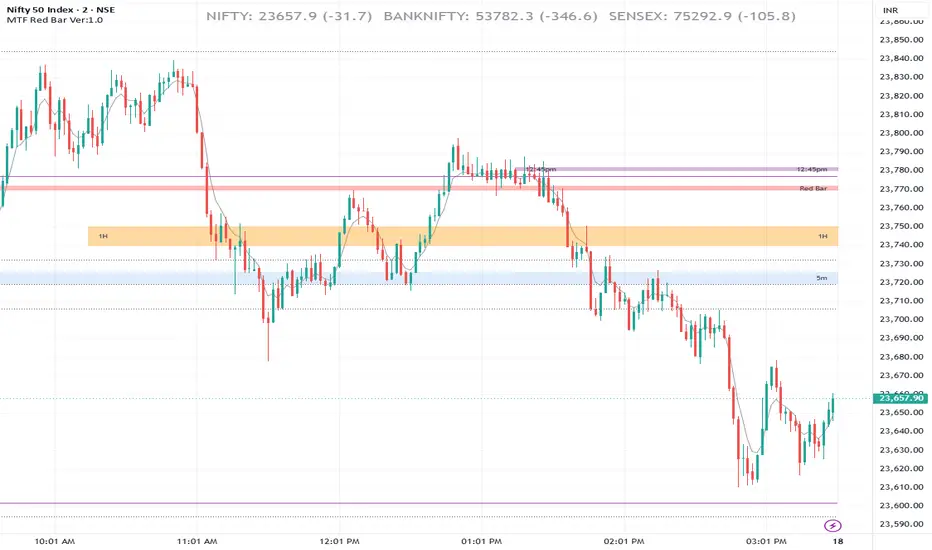
MTF Fibonacci Bands
The script tracks and marks four distinct dynamic horizontal zones (bands)
5m , 5m bearish, 1hour, Mid Hour.
For each tracked window, it plots a shaded structural channel between the 0.44 and 0.50 retracement steps of that specific range.
The 4 Active Intraday Bands:
The 5m Opening Band (09:15 – 09:20):
The Red Bar Band: Formed around the very first 5-minute bearish candle
The 1H Range Band (09:15 – 10:15)
The 12:45pm Mid-day Band (12:45 – 13:15)
Tracks the absolute high, low, and center point of the previous trading day's candle.
EMA 5 Line: Acts as an immediate short-term momentum tracker.
EMA 10/30 Fast Trend Cloud: A shaded ribbon that changes color dynamically based on moving average crossovers (Green for bullish expansion, Red for bearish pressure).
EMA 200 High/Low Channel
The script tracks and marks four distinct dynamic horizontal zones (bands)
5m , 5m bearish, 1hour, Mid Hour.
For each tracked window, it plots a shaded structural channel between the 0.44 and 0.50 retracement steps of that specific range.
The 4 Active Intraday Bands:
The 5m Opening Band (09:15 – 09:20):
The Red Bar Band: Formed around the very first 5-minute bearish candle
The 1H Range Band (09:15 – 10:15)
The 12:45pm Mid-day Band (12:45 – 13:15)
Tracks the absolute high, low, and center point of the previous trading day's candle.
EMA 5 Line: Acts as an immediate short-term momentum tracker.
EMA 10/30 Fast Trend Cloud: A shaded ribbon that changes color dynamically based on moving average crossovers (Green for bullish expansion, Red for bearish pressure).
EMA 200 High/Low Channel

면책사항
해당 정보와 게시물은 금융, 투자, 트레이딩 또는 기타 유형의 조언이나 권장 사항으로 간주되지 않으며, 트레이딩뷰에서 제공하거나 보증하는 것이 아닙니다. 자세한 내용은 이용 약관을 참조하세요.
면책사항
해당 정보와 게시물은 금융, 투자, 트레이딩 또는 기타 유형의 조언이나 권장 사항으로 간주되지 않으며, 트레이딩뷰에서 제공하거나 보증하는 것이 아닙니다. 자세한 내용은 이용 약관을 참조하세요.