Alpha Regime Dashboard [identityKa]
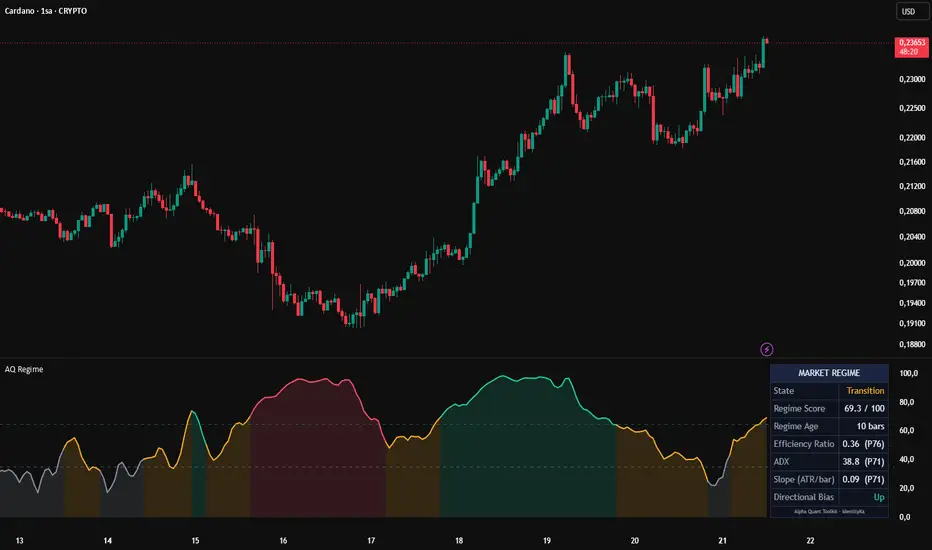
Alpha Regime Dashboard [identityKa]
**One question, answered clearly: is this market trending, choppy, or somewhere in between?**
Most trading mistakes are not bad entries. They are good entries taken in the wrong regime: a trend-following idea in a range, or a mean-reversion idea in a strong trend. This tool classifies the current regime so you can match your approach to the environment before you place a trade.
How it works
The score blends three independent measures of "trendiness":
1. **Efficiency Ratio (40%)**: net price change divided by the total distance price travelled over the lookback. Close to 1 means price moved in a straight line; close to 0 means it went nowhere despite lots of movement.
2. **ADX (30%)**: classic directional strength.
3. **EMA slope in ATR units (30%)**: how fast the trend EMA is moving, normalized by volatility so it is comparable across symbols.
Each component is then converted into a **percentile rank of its own recent history** (default 250 bars). This is the key idea: a "high ADX" on a slow index and a "high ADX" on a volatile altcoin mean very different things in raw numbers, but they are both "high relative to that market's own behavior". Because of this, the same thresholds work across crypto, stocks, indices and FX without manual tuning.
The blended score (0 to 100) is smoothed and passed through a **confirmation filter**: a new regime is only accepted after it persists for a set number of bars, which removes most of the flicker you see in raw threshold indicators.
Regimes
- **Trending Up / Trending Down**: score at or above the Trending threshold, with direction from EMA slope and price position
- **Transition**: between thresholds, the market is deciding
- **Choppy**: score at or below the Choppy threshold, movement without progress
What you see
- A pane with the regime score, colored by state
- A dashboard with State, Score, Regime Age (bars in the current regime), Efficiency Ratio, ADX, Slope and Directional Bias, each with its percentile rank
- Optional component rank lines to see which measure is driving the reading
How to use it
- Use it as a **context filter**, not a signal generator. Trend-following setups tend to make more sense in Trending regimes; mean-reversion setups tend to make more sense in Choppy regimes.
- Watch **Regime Age**: very young regimes are less reliable than established ones.
- Compare timeframes. A Trending regime on 4H inside a Choppy regime on 15m is a different situation from full alignment.
Settings
- **Calculation**: Efficiency Ratio length, ADX length, trend EMA length, slope lookback, adaptive rank window, score smoothing
- **Regime Rules**: Trending and Choppy thresholds, confirmation bars
- **Display / Dashboard**: colors, position, text size, footer toggle
Alerts
Alerts are available for Trending Up, Trending Down, Choppy, Transition and any regime change. For stable, non-repainting triggers, set the alert to **Once Per Bar Close**.
Notes and limitations
- Percentile ranking needs history. The first bars (equal to the rank window) show "Warming up".
- Regime classification describes what has been happening, not what will happen next. Regimes change.
- Values on the current, unfinished bar can change until the bar closes.
*This script is for educational and informational purposes only and is not financial advice. Past behavior does not guarantee future results.*
Part of the **Alpha Quant Toolkit** by identityKa: a series of free, open-source market analysis tools built on a common design standard.
**One question, answered clearly: is this market trending, choppy, or somewhere in between?**
Most trading mistakes are not bad entries. They are good entries taken in the wrong regime: a trend-following idea in a range, or a mean-reversion idea in a strong trend. This tool classifies the current regime so you can match your approach to the environment before you place a trade.
How it works
The score blends three independent measures of "trendiness":
1. **Efficiency Ratio (40%)**: net price change divided by the total distance price travelled over the lookback. Close to 1 means price moved in a straight line; close to 0 means it went nowhere despite lots of movement.
2. **ADX (30%)**: classic directional strength.
3. **EMA slope in ATR units (30%)**: how fast the trend EMA is moving, normalized by volatility so it is comparable across symbols.
Each component is then converted into a **percentile rank of its own recent history** (default 250 bars). This is the key idea: a "high ADX" on a slow index and a "high ADX" on a volatile altcoin mean very different things in raw numbers, but they are both "high relative to that market's own behavior". Because of this, the same thresholds work across crypto, stocks, indices and FX without manual tuning.
The blended score (0 to 100) is smoothed and passed through a **confirmation filter**: a new regime is only accepted after it persists for a set number of bars, which removes most of the flicker you see in raw threshold indicators.
Regimes
- **Trending Up / Trending Down**: score at or above the Trending threshold, with direction from EMA slope and price position
- **Transition**: between thresholds, the market is deciding
- **Choppy**: score at or below the Choppy threshold, movement without progress
What you see
- A pane with the regime score, colored by state
- A dashboard with State, Score, Regime Age (bars in the current regime), Efficiency Ratio, ADX, Slope and Directional Bias, each with its percentile rank
- Optional component rank lines to see which measure is driving the reading
How to use it
- Use it as a **context filter**, not a signal generator. Trend-following setups tend to make more sense in Trending regimes; mean-reversion setups tend to make more sense in Choppy regimes.
- Watch **Regime Age**: very young regimes are less reliable than established ones.
- Compare timeframes. A Trending regime on 4H inside a Choppy regime on 15m is a different situation from full alignment.
Settings
- **Calculation**: Efficiency Ratio length, ADX length, trend EMA length, slope lookback, adaptive rank window, score smoothing
- **Regime Rules**: Trending and Choppy thresholds, confirmation bars
- **Display / Dashboard**: colors, position, text size, footer toggle
Alerts
Alerts are available for Trending Up, Trending Down, Choppy, Transition and any regime change. For stable, non-repainting triggers, set the alert to **Once Per Bar Close**.
Notes and limitations
- Percentile ranking needs history. The first bars (equal to the rank window) show "Warming up".
- Regime classification describes what has been happening, not what will happen next. Regimes change.
- Values on the current, unfinished bar can change until the bar closes.
*This script is for educational and informational purposes only and is not financial advice. Past behavior does not guarantee future results.*
Part of the **Alpha Quant Toolkit** by identityKa: a series of free, open-source market analysis tools built on a common design standard.

면책사항
해당 정보와 게시물은 금융, 투자, 트레이딩 또는 기타 유형의 조언이나 권장 사항으로 간주되지 않으며, 트레이딩뷰에서 제공하거나 보증하는 것이 아닙니다. 자세한 내용은 이용 약관을 참조하세요.
면책사항
해당 정보와 게시물은 금융, 투자, 트레이딩 또는 기타 유형의 조언이나 권장 사항으로 간주되지 않으며, 트레이딩뷰에서 제공하거나 보증하는 것이 아닙니다. 자세한 내용은 이용 약관을 참조하세요.