OPEN-SOURCE SCRIPT
업데이트됨 Reversal Detection with Dynamic Stops - Multi-EMA Zigzag
Reversal Detection with Dynamic Stops - Multi-EMA Zigzag System
Description
Overview
The Reversal Detection with Dynamic Stops indicator is a comprehensive technical analysis tool that combines multiple exponential moving averages (EMAs) with an adaptive zigzag algorithm to identify significant price reversals and trend changes. This indicator is designed for active traders who need precise entry and exit signals with clear visual feedback.
Key Features
Multi-EMA Trend Detection
Triple EMA system (9, 14, 21 periods) provides robust trend identification
Dynamic bar coloring (Green = Bullish, Red = Bearish, Purple = Neutral)
Automated signal generation based on EMA alignment and price position
Adaptive Zigzag Algorithm
Configurable reversal detection using percentage, absolute value, or ATR-based thresholds
Choice between high/low or EMA-smoothed price input
Eliminates market noise while capturing significant price swings
Visual Reversal Markers
Bright, easy-to-read labels showing exact reversal prices with comma formatting
Horizontal reference lines extending from pivot points
Customizable line extension length (default 6 bars)
Labels positioned precisely at pivot highs and lows
Supply and Demand Zones (Optional)
Automatic identification of key support and resistance levels
Visual zone highlighting with translucent boxes
Configurable number of zones to display
How It Works
The indicator employs a two-stage analysis system:
Trend Identification: Three EMAs work together to determine the current market trend. When the 9 EMA is above the 14 EMA, which is above the 21 EMA, and price is above the 9 EMA, a bullish signal is generated. The inverse creates a bearish signal.
Reversal Detection: The zigzag algorithm tracks price extremes and confirms a reversal when price moves against the trend by a threshold amount (configurable as percentage, absolute value, or ATR multiple). Once confirmed, the indicator marks the pivot point with a label and horizontal line.
Recommended Settings by Timeframe
Scalping (1-5 minute charts)
Percentage Reversal: 0.5% - 1.0%
ATR Reversal: 1.5 - 2.0
Line Extension: 4-6 bars
Day Trading (15-60 minute charts)
Percentage Reversal: 1.0% - 1.5%
ATR Reversal: 2.0 - 3.0
Line Extension: 6-10 bars
Swing Trading (4H-Daily charts)
Percentage Reversal: 1.5% - 3.0%
ATR Reversal: 2.5 - 4.0
Line Extension: 10-20 bars
Input Parameters
Zigzag Settings
Method: Choose between "high_low" (actual candle extremes) or "average" (EMA-smoothed)
Percentage Reversal: Minimum percentage move to confirm reversal (default 0.01 = 1%)
Absolute Reversal: Minimum point move to confirm reversal (default 0.05)
ATR Reversal: ATR multiplier for dynamic threshold (default 2.0)
ATR Length: Period for ATR calculation (default 5)
Average Length: EMA smoothing period when using "average" method (default 5)
Visual Settings
Line Extension Bars: Number of bars to extend horizontal lines forward (default 6)
Show Supply/Demand: Toggle and style for supply/demand zones
Show Supply Demand Cloud: Enable translucent zone highlighting
EMA Settings (Fixed)
Fast EMA: 9 periods
Medium EMA: 14 periods
Slow EMA: 21 periods
Trading Applications
Entry Signals
Green reversal labels at bottoms indicate potential long entry points
Red reversal labels at tops indicate potential short entry points
Confirm with bar color alignment and overall trend direction
Exit Signals
Opposite color reversal labels suggest profit-taking opportunities
Bar color changes from green to purple or red signal weakening bullish momentum
Bar color changes from red to purple or green signal weakening bearish momentum
Stop Loss Placement
Horizontal lines serve as dynamic stop loss levels
Place stops just beyond the reversal pivot points
Adjust stops as new reversals are confirmed
Risk Management
Use multiple timeframe analysis for confirmation
Wait for bar color confirmation before entry
Avoid trading during conflicting signals (purple bars)
Best Practices
Multi-Timeframe Confirmation: Check higher timeframe trend before taking signals
Volume Verification: Combine with volume analysis for stronger confirmation
Market Context: Consider overall market conditions and key support/resistance levels
False Signals: During choppy, low-volume periods, increase reversal thresholds
Trending Markets: The indicator performs best in markets with clear trends and reversals
Alerts Available
Reversal Up: Triggers when bullish reversal is confirmed
Reversal Down: Triggers when bearish reversal is confirmed
Momentum Up: Triggers when bearish momentum weakens
Momentum Down: Triggers when bullish momentum weakens
Important Notes
This indicator repaints by design as it confirms reversals after price movement
Labels and lines are placed at historical pivot points when confirmed
The indicator works on all timeframes and markets (stocks, forex, crypto, futures)
Bar coloring provides continuous trend feedback independent of reversals
Adjust sensitivity based on volatility and timeframe
Disclaimer
This indicator is a technical analysis tool and should not be used as the sole basis for trading decisions. Always conduct your own analysis, use proper risk management, and never risk more than you can afford to lose. Past performance does not guarantee future results. The indicator repaints by nature of its reversal detection algorithm - reversals are only confirmed after price has moved the threshold amount.
Description
Overview
The Reversal Detection with Dynamic Stops indicator is a comprehensive technical analysis tool that combines multiple exponential moving averages (EMAs) with an adaptive zigzag algorithm to identify significant price reversals and trend changes. This indicator is designed for active traders who need precise entry and exit signals with clear visual feedback.
Key Features
Multi-EMA Trend Detection
Triple EMA system (9, 14, 21 periods) provides robust trend identification
Dynamic bar coloring (Green = Bullish, Red = Bearish, Purple = Neutral)
Automated signal generation based on EMA alignment and price position
Adaptive Zigzag Algorithm
Configurable reversal detection using percentage, absolute value, or ATR-based thresholds
Choice between high/low or EMA-smoothed price input
Eliminates market noise while capturing significant price swings
Visual Reversal Markers
Bright, easy-to-read labels showing exact reversal prices with comma formatting
Horizontal reference lines extending from pivot points
Customizable line extension length (default 6 bars)
Labels positioned precisely at pivot highs and lows
Supply and Demand Zones (Optional)
Automatic identification of key support and resistance levels
Visual zone highlighting with translucent boxes
Configurable number of zones to display
How It Works
The indicator employs a two-stage analysis system:
Trend Identification: Three EMAs work together to determine the current market trend. When the 9 EMA is above the 14 EMA, which is above the 21 EMA, and price is above the 9 EMA, a bullish signal is generated. The inverse creates a bearish signal.
Reversal Detection: The zigzag algorithm tracks price extremes and confirms a reversal when price moves against the trend by a threshold amount (configurable as percentage, absolute value, or ATR multiple). Once confirmed, the indicator marks the pivot point with a label and horizontal line.
Recommended Settings by Timeframe
Scalping (1-5 minute charts)
Percentage Reversal: 0.5% - 1.0%
ATR Reversal: 1.5 - 2.0
Line Extension: 4-6 bars
Day Trading (15-60 minute charts)
Percentage Reversal: 1.0% - 1.5%
ATR Reversal: 2.0 - 3.0
Line Extension: 6-10 bars
Swing Trading (4H-Daily charts)
Percentage Reversal: 1.5% - 3.0%
ATR Reversal: 2.5 - 4.0
Line Extension: 10-20 bars
Input Parameters
Zigzag Settings
Method: Choose between "high_low" (actual candle extremes) or "average" (EMA-smoothed)
Percentage Reversal: Minimum percentage move to confirm reversal (default 0.01 = 1%)
Absolute Reversal: Minimum point move to confirm reversal (default 0.05)
ATR Reversal: ATR multiplier for dynamic threshold (default 2.0)
ATR Length: Period for ATR calculation (default 5)
Average Length: EMA smoothing period when using "average" method (default 5)
Visual Settings
Line Extension Bars: Number of bars to extend horizontal lines forward (default 6)
Show Supply/Demand: Toggle and style for supply/demand zones
Show Supply Demand Cloud: Enable translucent zone highlighting
EMA Settings (Fixed)
Fast EMA: 9 periods
Medium EMA: 14 periods
Slow EMA: 21 periods
Trading Applications
Entry Signals
Green reversal labels at bottoms indicate potential long entry points
Red reversal labels at tops indicate potential short entry points
Confirm with bar color alignment and overall trend direction
Exit Signals
Opposite color reversal labels suggest profit-taking opportunities
Bar color changes from green to purple or red signal weakening bullish momentum
Bar color changes from red to purple or green signal weakening bearish momentum
Stop Loss Placement
Horizontal lines serve as dynamic stop loss levels
Place stops just beyond the reversal pivot points
Adjust stops as new reversals are confirmed
Risk Management
Use multiple timeframe analysis for confirmation
Wait for bar color confirmation before entry
Avoid trading during conflicting signals (purple bars)
Best Practices
Multi-Timeframe Confirmation: Check higher timeframe trend before taking signals
Volume Verification: Combine with volume analysis for stronger confirmation
Market Context: Consider overall market conditions and key support/resistance levels
False Signals: During choppy, low-volume periods, increase reversal thresholds
Trending Markets: The indicator performs best in markets with clear trends and reversals
Alerts Available
Reversal Up: Triggers when bullish reversal is confirmed
Reversal Down: Triggers when bearish reversal is confirmed
Momentum Up: Triggers when bearish momentum weakens
Momentum Down: Triggers when bullish momentum weakens
Important Notes
This indicator repaints by design as it confirms reversals after price movement
Labels and lines are placed at historical pivot points when confirmed
The indicator works on all timeframes and markets (stocks, forex, crypto, futures)
Bar coloring provides continuous trend feedback independent of reversals
Adjust sensitivity based on volatility and timeframe
Disclaimer
This indicator is a technical analysis tool and should not be used as the sole basis for trading decisions. Always conduct your own analysis, use proper risk management, and never risk more than you can afford to lose. Past performance does not guarantee future results. The indicator repaints by nature of its reversal detection algorithm - reversals are only confirmed after price has moved the threshold amount.
릴리즈 노트
Reversal Detection with Mobius Supply/Demand Zones v2.1UPDATE v2.1
• Mobius arrows now only print when candle CLOSES above/below the white dashed RO lines (no more wick triggers)
• Mobius arrows show CURRENT signal only - no historical arrows cluttering the chart
• Bright green and bright red arrow colors for better visibility
• "Next Confirmation" line now shows dynamic POINTS remaining instead of percentage
• Confirmation line starts at current candle (not 4 bars back)
• Added Line Style option for confirmation line (Solid, Dashed, Dotted)
• Simplified settings - removed unused Percentage Reversal and Absolute Reversal inputs
• Changed Triple EMA to 8/13/20
• ATR Reversal Multiplier now adjusts in 0.1 increments
• Added tooltips to all settings for clarity
═══════════════════════════════════════════════════════
This indicator combines adaptive zigzag reversal detection with Mobius-style ATR-based supply and demand zones, providing clear visual signals for potential trend reversals and actionable trading areas.
What It Does
The indicator identifies swing high and swing low pivots using an ATR-adaptive algorithm, then plots corresponding supply (red) and demand (green) zones based on Mobius Trend Pivot methodology. When price confirms a reversal, labels display the exact pivot price.
Key Features
• Triple EMA trend detection (8/13/20) with color-coded bars
• ATR-adaptive reversal sensitivity that adjusts to market volatility
• Supply Zone (red) marks areas where sellers took control
• Demand Zone (green) marks areas where buyers stepped in
• White dashed "rollover" lines show early warning levels
• Entry arrows appear only when price CLOSES beyond confirmation lines
• Dynamic "Next Confirmation" line shows points remaining to next reversal
• Fully configurable sensitivity, visuals, and display options
How To Use
1. Watch for reversal labels at swing highs (red) and swing lows (green)
2. Use supply/demand zones as potential support and resistance areas
3. Entry arrows (LONG/SHORT) trigger when price closes beyond the white dashed rollover lines
4. The confirmation line shows how many points until the next reversal signal
Settings Guide
• Method: "average" adds smoothing (less noise), "high_low" is faster (more responsive)
• ATR Reversal Multiplier: Lower = more signals, Higher = fewer but stronger signals
• ATR Length: Lookback period for volatility calculation
• Zone Transparency: Adjust visibility of supply/demand zones
• Show Trigger Arrows: Toggle entry signal arrows on/off
Best For
• Futures scalping and day trading (MNQ, MES, MYM, MGC, MCL)
• Identifying key support and resistance levels
• Timing entries with volatility-adjusted confirmation
• Any liquid instrument on any timeframe
Credits
Mobius Trend Pivot concept originally developed by Mobius for ThinkOrSwim.
Pine Script conversion and enhancements by NPR21.
═══════════════════════════════════════════════════════
릴리즈 노트
Reversal Detection with Mobius Supply/Demand Zones v3.0 [NPR21]UPDATE v3.0 — February 12, 2026
- Replaced zigzag reversal engine with AGAIG N-bar pivot detection for faster, zero-lag turn detection
- Added Signal Mode: Confirmed Only or Confirmed + Preview (real-time flickering pivots)
- Entry/TP/SL now based on close of pivot bar (realistic entry price)
- New reversal auto-replaces active trade
- Trend Period now supports 0.5 step increments for fine-tuning Mobius zones
- Added customizable colors for Entry, SL, TP1, TP2, TP3
- Added label size controls for trade levels and zone labels
- Removed confirmation line (zigzag-specific, not applicable to AGAIG)
This indicator combines AGAIG N-bar pivot reversal detection with Mobius-style ATR-based supply and demand zones, providing automatic trade management with Entry, Take Profit, and Stop Loss levels at every confirmed reversal.
═══════════════════════════════════════════════════
WHAT IT DOES
═══════════════════════════════════════════════════
Detects swing high and swing low pivots using the AGAIG (As Good As It Gets) pivot method, which identifies structural turning points in price with zero lag. Each confirmed reversal automatically generates:
- Entry level (close of the pivot bar)
- Three take profit levels (TP1, TP2, TP3) based on ATR
- Stop Loss level based on ATR
- Reversal label with exact pivot price
Mobius Trend Pivot supply (red) and demand (green) zones provide visual context showing where institutional accumulation and distribution areas are forming.
═══════════════════════════════════════════════════
HOW IT WORKS
═══════════════════════════════════════════════════
REVERSAL DETECTION (AGAIG)
The AGAIG method uses ta.pivothigh() and ta.pivotlow() with a configurable N-bar lookback. A pivot high is confirmed when the high of bar[N] is greater than the highs of N bars on both sides. A pivot low is confirmed when the low of bar[N] is less than the lows of N bars on both sides.
With the default N=2, confirmation takes only 2 bars after the pivot — the fastest reliable detection for scalping.
SIGNAL MODES
Confirmed Only — Reversal labels and trade levels appear only after the pivot bar is fully confirmed. No repainting.
Confirmed + Preview — In addition to confirmed signals, semi-transparent "?" labels appear in real-time showing potential pivots forming on the current bar. These flicker on and off until the bar closes. If confirmed, the preview is replaced by the solid label and trade levels are drawn.
TRADE MANAGEMENT
When a reversal confirms:
- Entry is set at the close of the pivot bar (realistic fill price)
- TP1, TP2, TP3 are calculated as Entry ± (ATR × Multiplier)
- Stop Loss is calculated as Entry ∓ (ATR × Multiplier)
- A new reversal automatically replaces any active trade
- Trade closes when TP3 or Stop Loss is hit
MOBIUS SUPPLY/DEMAND ZONES
Supply zones (red) form when N consecutive bars show higher highs with higher lows. Demand zones (green) form when N consecutive bars show lower lows with lower highs. The Trend Period input controls sensitivity with 0.5 step resolution for fine-tuning.
Rollover lines (dashed) within each zone show early warning levels. Zone labels identify Supply and Demand areas.
═══════════════════════════════════════════════════
HOW TO USE
═══════════════════════════════════════════════════
1. Wait for a confirmed reversal label to appear
2. Note the Entry price — this is where you would enter the trade
3. Set your stop loss at the SL level shown
4. Scale out at TP1, TP2, and TP3 levels
5. Use the Mobius zones as additional context — reversals inside or near zone boundaries have higher confluence
For scalping (1-5 minute charts):
- Use Pivot Lookback N=2 for fastest signals
- Lower ATR multipliers for tighter targets (TP1=1, TP2=1.5, TP3=2.5)
For swing trading (15-minute to daily):
- Use Pivot Lookback N=3 to N=5 for fewer, higher-quality signals
- Standard ATR multipliers work well
═══════════════════════════════════════════════════
SETTINGS
═══════════════════════════════════════════════════
REVERSAL DETECTION (AGAIG)
- Pivot Lookback (N): Bars left/right for pivot confirmation (default 2, range 1-25)
- Signal Mode: Confirmed Only or Confirmed + Preview
- ATR Length: Period for ATR calculation used in TP/SL (default 5)
MOBIUS ZONE SETTINGS
- Trend Period (n): Zone sensitivity with 0.5 step increments (default 5.0)
- Risk Multiplier: Zone width factor (default 0.7)
- Show Supply/Demand Zones, Rollover Lines, Zone Labels: Toggle visibility
TRADE MANAGEMENT
- SL Multiplier (ATR): Stop loss distance (default 1.0)
- TP1 Multiplier (ATR): First target distance (default 1.5)
- TP2 Multiplier (ATR): Second target distance (default 2.5)
- TP3 Multiplier (ATR): Third target distance (default 4.0)
- Label Size: Tiny, Small, Normal, or Large
- Entry/SL/TP1/TP2/TP3 Colors: Fully customizable
REVERSAL LABEL SETTINGS
- Show Reversal Labels: Toggle on/off
- Show Historical Reversals: Show all past reversals or current only
- Reversal Line Extension Bars: How far the reversal level line extends
BAR COLORING
- Color bars based on triple EMA trend direction (green = bullish, red = bearish, fuchsia = neutral)
═══════════════════════════════════════════════════
WORKS GREAT FOR
═══════════════════════════════════════════════════
- Futures scalping (MNQ, MES, MYM, MGC, MCL)
- Day trading on 1-5 minute charts
- Swing trading on 15-minute to daily charts
- Forex pairs and crypto
- Any liquid instrument on any timeframe
═══════════════════════════════════════════════════
CREDITS
═══════════════════════════════════════════════════
Mobius Trend Pivot methodology originally created by Mobius for ThinkOrSwim.
AGAIG pivot detection and Pine Script integration by NPR21.
═══════════════════════════════════════════════════
This indicator is an educational tool. Use proper risk management and test thoroughly before trading with real capital. Past performance does not guarantee future results.
Happy Trading,
NPR21
릴리즈 노트
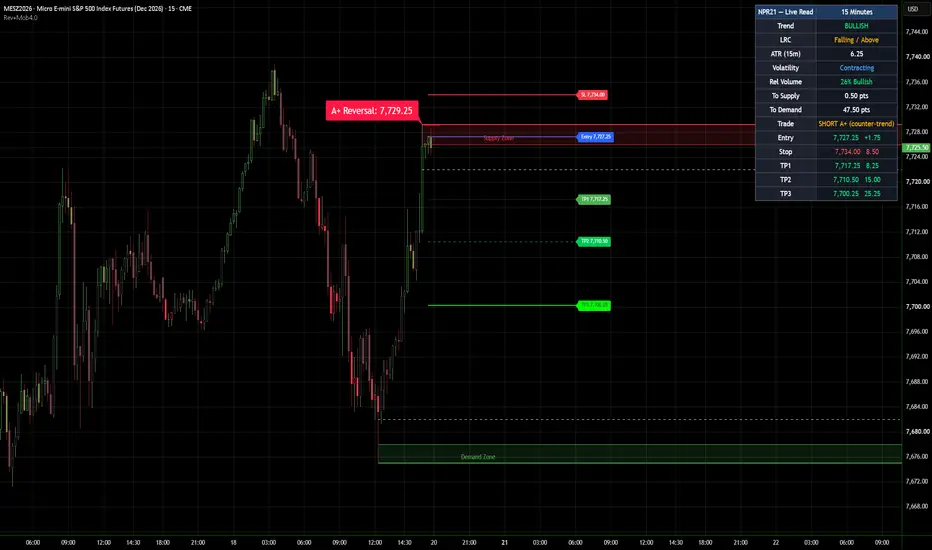
UPDATE — September 19, 2026A ground-up rebuild of the reversal engine, now with supply/demand confluence grading and a full live dashboard.
Confluence grading (A+). Reversals that fire inside their matching zone — bullish in demand, bearish in supply — are graded A+ and marked distinctly. A new "Show A+ Only" mode strips the chart down to just the graded, high-conviction signals.
Non-repainting. All intrabar preview pivots have been removed. Every reversal now prints only on a confirmed pivot and stays put — no repainting.
Realistic entries and trade management. Entries fill on the confirmation bar — a price you can actually get — with a study-only pivot fill available for research. TP1, TP2, TP3 and the stop are each latched so alerts fire once, with break-even after TP1 and an optional ATR trail after TP2. Stop-and-target conflicts on a single bar resolve conservatively.
Live Dashboard. A new on-chart panel reads the current timeframe at a glance: Trend, linear-regression perspective, ATR, volatility regime, and relative volume with bullish/bearish pressure. It shows live distance to the nearest supply and demand, plus a trade cockpit — entry with live open P/L, working stop, and TP1/TP2/TP3 as actual prices with the live distance to each target. Trades that fight the trend are flagged counter-trend. Nine panel positions and a high-contrast layout.
Universal — works on any symbol and any timeframe.
Tags: reversal, supply and demand, confluence, pivot, scalping, futures, ATR, trend, volume, dashboard, take profit, stop loss, risk management
Great Trading! ~ NPR21
오픈 소스 스크립트
트레이딩뷰의 진정한 정신에 따라, 이 스크립트의 작성자는 이를 오픈소스로 공개하여 트레이더들이 기능을 검토하고 검증할 수 있도록 했습니다. 작성자에게 찬사를 보냅니다! 이 코드는 무료로 사용할 수 있지만, 코드를 재게시하는 경우 하우스 룰이 적용된다는 점을 기억하세요.

NPR21 Premium Indicators | Access all tiers at whop.com/npr21 | DM me on TradingView for questions
면책사항
해당 정보와 게시물은 금융, 투자, 트레이딩 또는 기타 유형의 조언이나 권장 사항으로 간주되지 않으며, 트레이딩뷰에서 제공하거나 보증하는 것이 아닙니다. 자세한 내용은 이용 약관을 참조하세요.
오픈 소스 스크립트
트레이딩뷰의 진정한 정신에 따라, 이 스크립트의 작성자는 이를 오픈소스로 공개하여 트레이더들이 기능을 검토하고 검증할 수 있도록 했습니다. 작성자에게 찬사를 보냅니다! 이 코드는 무료로 사용할 수 있지만, 코드를 재게시하는 경우 하우스 룰이 적용된다는 점을 기억하세요.
NPR21 Premium Indicators | Access all tiers at whop.com/npr21 | DM me on TradingView for questions
면책사항
해당 정보와 게시물은 금융, 투자, 트레이딩 또는 기타 유형의 조언이나 권장 사항으로 간주되지 않으며, 트레이딩뷰에서 제공하거나 보증하는 것이 아닙니다. 자세한 내용은 이용 약관을 참조하세요.