OPEN-SOURCE SCRIPT
Swing High/Low Lines (Break Stop)
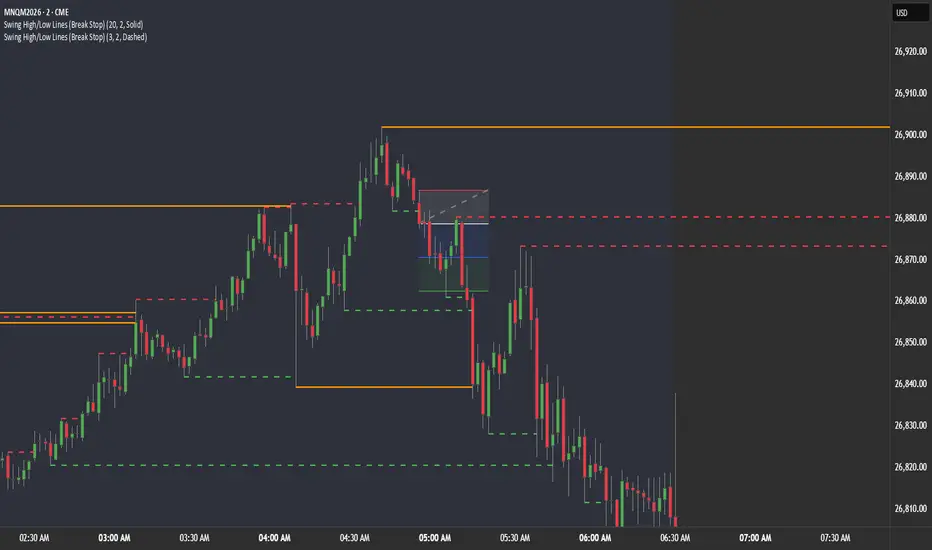
Swing High/Low Lines (with alerts) – Strategy Description
This indicator automatically identifies market structure using swing highs and swing lows, then plots horizontal levels that extend forward until price breaks them. It is designed to track liquidity levels, highlight potential breakout points, and provide clean, event-based alerts.
Core Functionality
Detects swing highs and swing lows using a configurable strength setting
Plots each swing as a horizontal line starting at the pivot point
Lines extend forward in real time until price interacts with them
Once a level is broken, the line stops extending and is removed from tracking
Swing Detection
Uses ta.pivothigh and ta.pivotlow
The strength input defines how many candles are required on each side of a pivot
Higher strength = fewer, more significant levels
Lower strength = more frequent, sensitive levels
Line Behavior
Each swing level is drawn as an independent horizontal line
Lines extend right automatically as long as they remain unbroken
When price breaks a level:
The line is cut off at the break point
It is removed from active tracking
Prevents clutter by only keeping valid, untested levels active
Break Logic
Configurable via “Break on Wick” option:
Enabled (default):
A level is considered broken when price wicks through it
Disabled:
A level is only broken when price closes beyond it
This allows adaptation for:
Aggressive (wick-based liquidity grabs)
Conservative (confirmed close-based breaks)
Alerts
The script includes two types of alerts:
1. Swing Creation Alerts
Triggered when a new level forms:
New Swing High
New Swing Low
Useful for:
Tracking fresh structure
Identifying new liquidity zones
2. Break Alerts
Triggered when price crosses any active level:
Swing High Broken
Swing Low Broken
Behavior:
Fires as soon as price breaches a level (based on wick/close setting)
Works across all active swing levels simultaneously
Useful for:
Breakout entries
Liquidity sweeps
Structure shifts
Internal Tracking System
Uses arrays to store:
Active swing lines
Corresponding price levels
Continuously checks each level for break conditions
Efficiently removes invalidated levels in real time
Visual Customization
Adjustable colors for highs and lows
Configurable line width
Selectable line style:
Solid
Dashed
Dotted
Use Case
This indicator is built for traders who rely on:
Market structure
Liquidity sweeps
Breakout confirmation
Clean chart visualization without outdated levels
It ensures that only relevant, unbroken swing levels remain on the chart while providing immediate alerts when those levels are created or taken out.
오픈 소스 스크립트
트레이딩뷰의 진정한 정신에 따라, 이 스크립트의 작성자는 이를 오픈소스로 공개하여 트레이더들이 기능을 검토하고 검증할 수 있도록 했습니다. 작성자에게 찬사를 보냅니다! 이 코드는 무료로 사용할 수 있지만, 코드를 재게시하는 경우 하우스 룰이 적용된다는 점을 기억하세요.

면책사항
해당 정보와 게시물은 금융, 투자, 트레이딩 또는 기타 유형의 조언이나 권장 사항으로 간주되지 않으며, 트레이딩뷰에서 제공하거나 보증하는 것이 아닙니다. 자세한 내용은 이용 약관을 참조하세요.
오픈 소스 스크립트
트레이딩뷰의 진정한 정신에 따라, 이 스크립트의 작성자는 이를 오픈소스로 공개하여 트레이더들이 기능을 검토하고 검증할 수 있도록 했습니다. 작성자에게 찬사를 보냅니다! 이 코드는 무료로 사용할 수 있지만, 코드를 재게시하는 경우 하우스 룰이 적용된다는 점을 기억하세요.
면책사항
해당 정보와 게시물은 금융, 투자, 트레이딩 또는 기타 유형의 조언이나 권장 사항으로 간주되지 않으며, 트레이딩뷰에서 제공하거나 보증하는 것이 아닙니다. 자세한 내용은 이용 약관을 참조하세요.