OPEN-SOURCE SCRIPT
Lunar Cycle Oscillator [PyraTime]
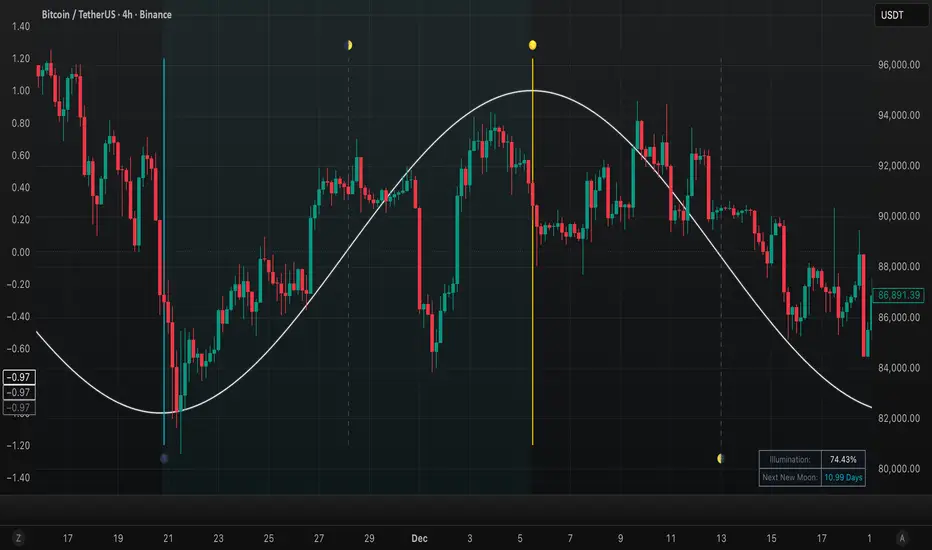
The Lunar Cycle Oscillator V1 is a predictive, timeframe-agnostic visualizer designed for traders who utilize Gann theory and astronomical cycles. It plots the Moon’s exact ~29.53-day synodic phase as a fluid, oscillating wave. Designed with a premium dark-mode aesthetic (Navy, Grey, Cyan, and Gold), it provides immediate visual context for market turning points aligned with lunar events.
Core Features
Neon Glow Wave: A multi-layered, silver-core sine wave that oscillates between -1.0 (New Moon) and 1.0 (Full Moon).
Precision Pulse Markers: Vertical event lines for Full Moons (Gold), New Moons (Cyan), and Quarter Moons (Dashed Grey).
Future Projections: Automatically forecasts the exact timing of the next three lunar phases into the future chart space at 70% transparency.
Dynamic Background Shading: Subtle pane shading that transitions between deep navy (Waning) and faint cyan (Waxing) to frame the oscillator.
Live Data Table: A real-time HUD displaying the current lunar illumination percentage and a day-countdown to the next major phase.
Integrated Alerts: Ready-to-use alert conditions for all four major lunar phase transitions.
Mathematical Methodology & Engineering
This indicator bypasses standard bar-counting limits. Instead of relying on relative bar references (which break on different timeframes), it calculates the exact astronomical phase using a known historical New Moon UNIX timestamp combined with the length of a synodic month in milliseconds.
Crucially, this script completely eliminates the Floating Indicator Issue. By anchoring every single line, label, and future projection strictly to xloc=xloc.bar_time, graphical objects will never detach, drift, or freeze in mid-air when panning or zooming. They are permanently locked to their exact moment in historical or future time.
Understanding "Jagged" Waves on Certain Assets
If you apply this indicator to a 5-day-a-week asset (like Gold, Forex, or traditional equities), the sine wave may occasionally look "chopped" or jagged at the peaks and troughs.
The Cause: The lunar cycle continues over the weekend, but the market does not. If a Full Moon peaks on a Saturday, the chart draws a rigid, straight line from Friday's close directly to Monday's open, cutting off the smooth weekend curve.
The Verification: To see the pure, mathematically perfect sine wave, apply the indicator to a 24/7 asset like Bitcoin (BTCUSD), where no weekend X-axis gaps exist.
Recommended Chart Setup (TradingView)
To achieve the optimal visual aesthetic and minimize chart gaps, apply the following settings to your TradingView chart:
Hide Background Grid Lines: The neon glow effect looks best on a clean, dark canvas. Right-click your chart background, select Settings, navigate to the Canvas tab, locate Grid lines, and drop the opacity slider down to 0% (or set them to match your exact background color).
Enable Extended Trading Hours (ETH): To smooth out the wave on traditional markets by filling in missing data gaps, turn on Extended Hours. Click the RTH / ETH button in the bottom right corner of your chart (next to the time zone) and select Extended Trading Hours, or go to Settings > Symbol and change the Session to Extended. Note: Pure weekend data availability depends entirely on your specific broker's feed.
Core Features
Neon Glow Wave: A multi-layered, silver-core sine wave that oscillates between -1.0 (New Moon) and 1.0 (Full Moon).
Precision Pulse Markers: Vertical event lines for Full Moons (Gold), New Moons (Cyan), and Quarter Moons (Dashed Grey).
Future Projections: Automatically forecasts the exact timing of the next three lunar phases into the future chart space at 70% transparency.
Dynamic Background Shading: Subtle pane shading that transitions between deep navy (Waning) and faint cyan (Waxing) to frame the oscillator.
Live Data Table: A real-time HUD displaying the current lunar illumination percentage and a day-countdown to the next major phase.
Integrated Alerts: Ready-to-use alert conditions for all four major lunar phase transitions.
Mathematical Methodology & Engineering
This indicator bypasses standard bar-counting limits. Instead of relying on relative bar references (which break on different timeframes), it calculates the exact astronomical phase using a known historical New Moon UNIX timestamp combined with the length of a synodic month in milliseconds.
Crucially, this script completely eliminates the Floating Indicator Issue. By anchoring every single line, label, and future projection strictly to xloc=xloc.bar_time, graphical objects will never detach, drift, or freeze in mid-air when panning or zooming. They are permanently locked to their exact moment in historical or future time.
Understanding "Jagged" Waves on Certain Assets
If you apply this indicator to a 5-day-a-week asset (like Gold, Forex, or traditional equities), the sine wave may occasionally look "chopped" or jagged at the peaks and troughs.
The Cause: The lunar cycle continues over the weekend, but the market does not. If a Full Moon peaks on a Saturday, the chart draws a rigid, straight line from Friday's close directly to Monday's open, cutting off the smooth weekend curve.
The Verification: To see the pure, mathematically perfect sine wave, apply the indicator to a 24/7 asset like Bitcoin (BTCUSD), where no weekend X-axis gaps exist.
Recommended Chart Setup (TradingView)
To achieve the optimal visual aesthetic and minimize chart gaps, apply the following settings to your TradingView chart:
Hide Background Grid Lines: The neon glow effect looks best on a clean, dark canvas. Right-click your chart background, select Settings, navigate to the Canvas tab, locate Grid lines, and drop the opacity slider down to 0% (or set them to match your exact background color).
Enable Extended Trading Hours (ETH): To smooth out the wave on traditional markets by filling in missing data gaps, turn on Extended Hours. Click the RTH / ETH button in the bottom right corner of your chart (next to the time zone) and select Extended Trading Hours, or go to Settings > Symbol and change the Session to Extended. Note: Pure weekend data availability depends entirely on your specific broker's feed.
오픈 소스 스크립트
트레이딩뷰의 진정한 정신에 따라, 이 스크립트의 작성자는 이를 오픈소스로 공개하여 트레이더들이 기능을 검토하고 검증할 수 있도록 했습니다. 작성자에게 찬사를 보냅니다! 이 코드는 무료로 사용할 수 있지만, 코드를 재게시하는 경우 하우스 룰이 적용된다는 점을 기억하세요.

While the world trades price, we trade Time & Price.
Access our proprietary Indicator Suite: pivotzilla.com
Access our proprietary Indicator Suite: pivotzilla.com
면책사항
해당 정보와 게시물은 금융, 투자, 트레이딩 또는 기타 유형의 조언이나 권장 사항으로 간주되지 않으며, 트레이딩뷰에서 제공하거나 보증하는 것이 아닙니다. 자세한 내용은 이용 약관을 참조하세요.
오픈 소스 스크립트
트레이딩뷰의 진정한 정신에 따라, 이 스크립트의 작성자는 이를 오픈소스로 공개하여 트레이더들이 기능을 검토하고 검증할 수 있도록 했습니다. 작성자에게 찬사를 보냅니다! 이 코드는 무료로 사용할 수 있지만, 코드를 재게시하는 경우 하우스 룰이 적용된다는 점을 기억하세요.
While the world trades price, we trade Time & Price.
Access our proprietary Indicator Suite: pivotzilla.com
Access our proprietary Indicator Suite: pivotzilla.com
면책사항
해당 정보와 게시물은 금융, 투자, 트레이딩 또는 기타 유형의 조언이나 권장 사항으로 간주되지 않으며, 트레이딩뷰에서 제공하거나 보증하는 것이 아닙니다. 자세한 내용은 이용 약관을 참조하세요.